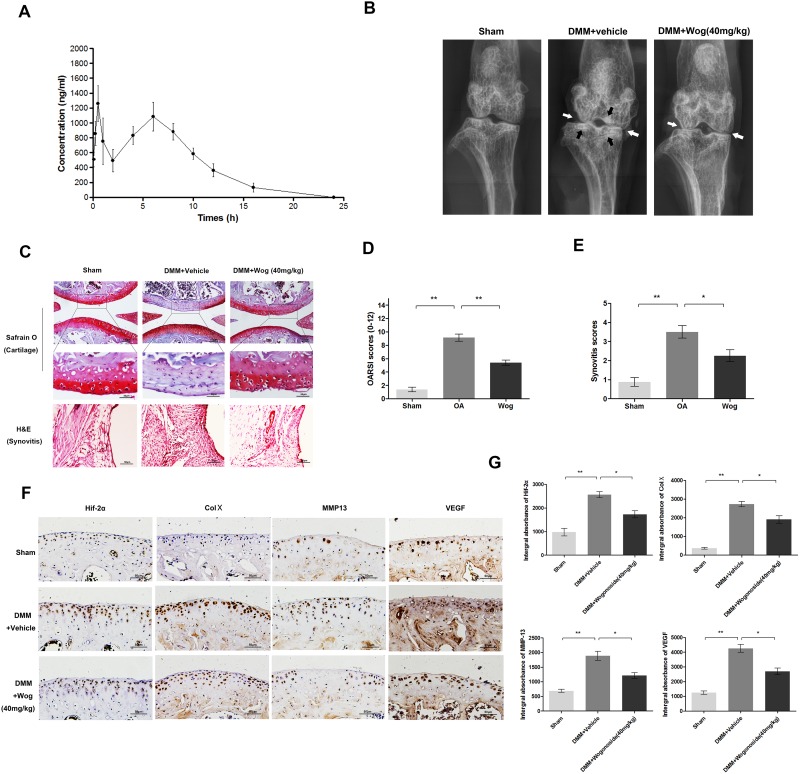
Figure 10. Wogonoside ameliorates OA development in mice DMM model in vivo.
(A) Concentration-time curve of wogonoside administration in rats. (B) Digital X-ray image of mouse knee joints from different experimental groups. Narrowing of joint space was found in both OA and treatment group (white arrows), the calcification of cartilage surface was obviously shown in OA group (black arrows). (C) Representative S-O staining of cartilage and H&E staining of synovitis from different experimental groups at 8 weeks post-surgery (original magnification × 100 or ×400, scale bar: 100 μm or 50μm). (D) Diagrams showed the OARIS socres of cartilage. (E) Diagrams showed the scores of synovitis. (F-G) immunohistochemical staining of HIF-2α, Col X, MMP-13 and VEGF-A expression in the cartilage samples (original magnification × 100, scale bar: 50 μm). The data in the figures represent the averages ± S.D. Significant differences between the treatment and control groups are indicated as **P<0.01, *P<0.05, n = 3.

