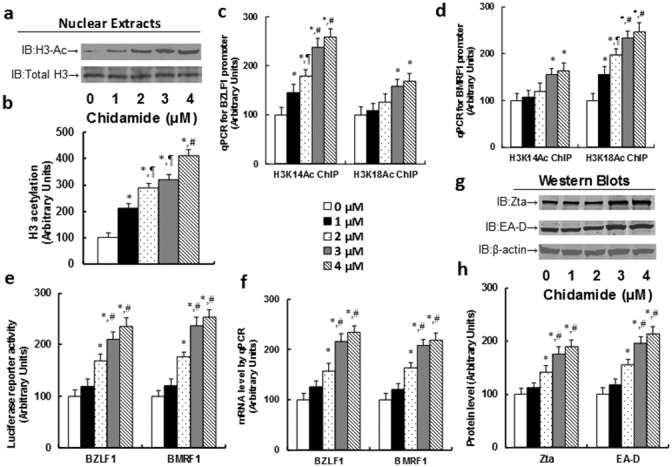
Figure 2. Chidamide (CDM) treatment activates the EBV lytic gene expression through increased H3 acetylation in LCL cells.

The LCL cells were treated with different concentrations of chidamide (CDM) for 24 hours, and the cells were harvested for analysis. (a) Representative pictures for H3 acetylation. (b) H3 acetylation quantitation from Western Blots, n=5. (c) ChIP analysis on BZLF1 promoter, n=4. (d) ChIP analysis on BMRF1 promoter, n=4. (e) Luciferase reporter assay for BZLF1 and BMRF1, n=5. (f) mRNA level by qPCR, n=4. (g) Representative picture of Western Blots. (h) Protein quantitation for Zta and EA-D, n=5. *, P<0.05, vs 0 μM Chidamide; ¶, P<0.05, vs 1 μM Chidamide; #, P<0.05, vs 2 μM Chidamide. Results are expressed as mean ± SEM.
