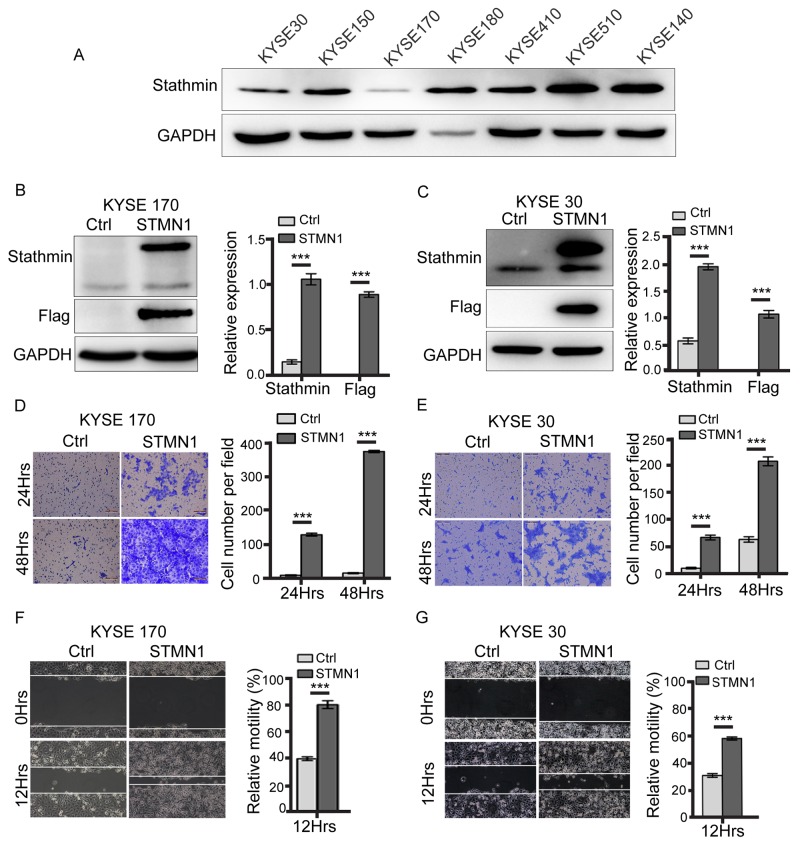
Figure 2. Stathmin promoted ESCC cell invasion and migration.
(A) Stathmin expression in seven ESCC cell lines was examined by western blotting. GAPDH was used as a loading control. (B, C) Immunoblotting was used to analyze the stathmin protein level in KYSE 170 and KYSE 30 cells. Control (Ctrl) represents KYSE 170 or KYSE 30 cells transfected with the control plasmid; STMN1 represents KYSE 170 or KYSE 30 cells transfected with STMN1-plasmid. (D, E) The transwell invasion system demonstrated an enhanced invasion capacity of the KYSE 170 and KYSE 30 stathmin-overexpression groups compared with controls. Images of invading cells were captured by phase contrast microscopy at 200× magnification. The y-axis represents the number of invading cells. (F, G) A wound-healing assay was performed to investigate the migratory potential of KYSE 170 and KSYE 30 cells after stathmin levels changed. In the quantitative migration assay results, the y-axis represents the migration rate relative to that of control cells. Stathmin overexpression significantly promoted the migration ability of both cell lines. All assays were replicated, and results are presented as the mean±SD (*, P<0.05).

