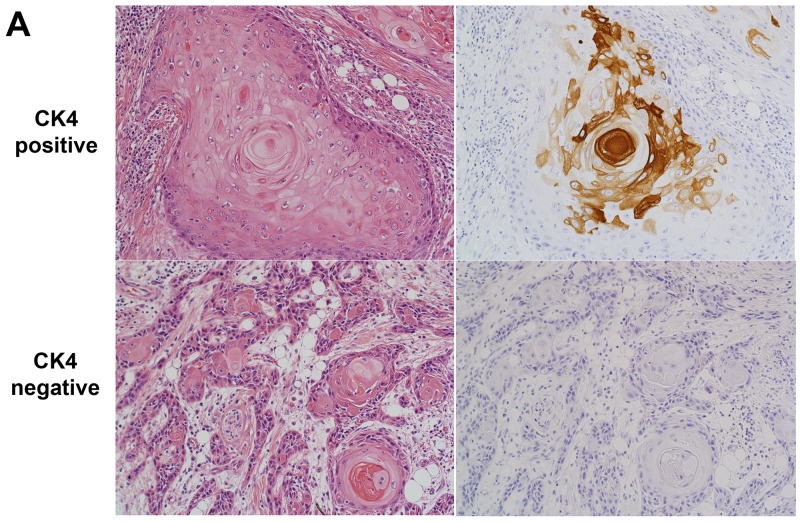
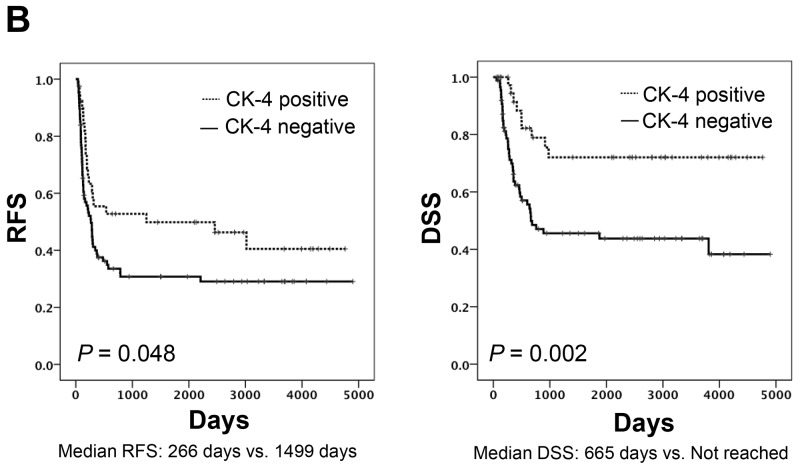
Figure 4. Relationship between CK4 protein expression, RFS and DSS.
(A) Micrograph of a representative TSCC expressing CK4 protein detected byimmunohistochemical staining. Left, hematoxylin & eosin; right, CK4. (B) Kaplan-Meier curves drawn according to CK4 protein expression by immunohistochemical staining. Left, RFS, Log-rank test, P value = 0.048. Right, DDS Log-rank test, P value = 0.002.


