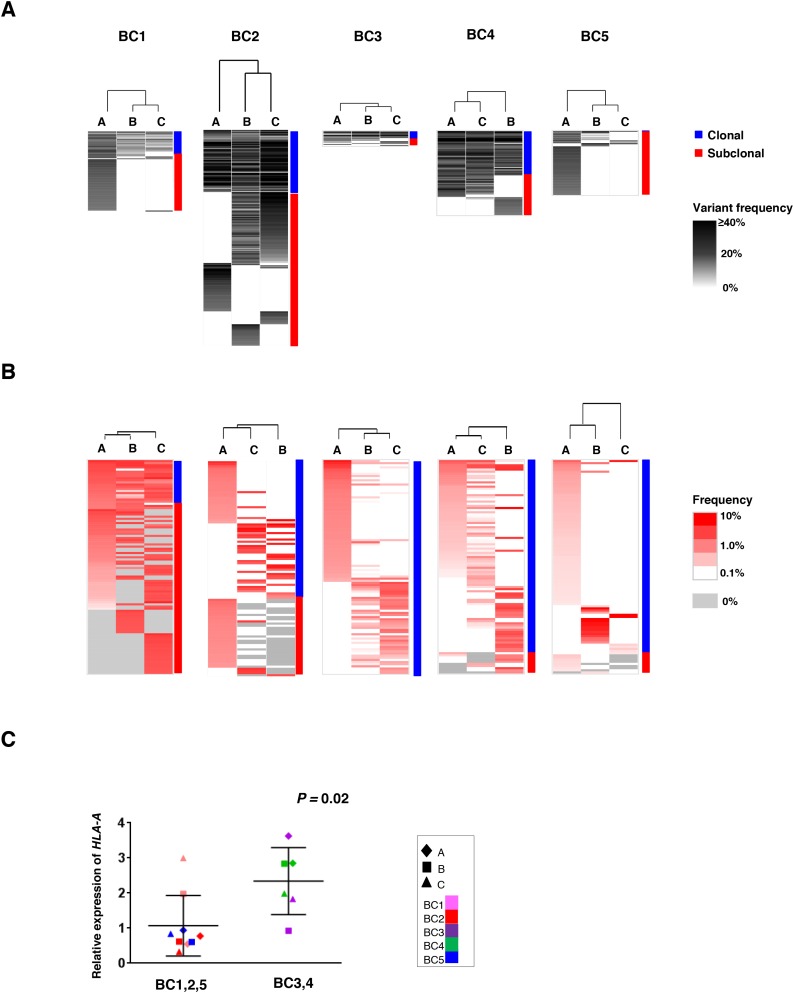
Figure 3. Clustering analysis of the multiregional non-synonymous mutation profiles and TCRB repertoires.
Three different portions of individual tumors were shown as hierarchical clustering by calculating their similarity in the datasets of non-synonymous mutations (A) and TCRB repertoires (B). Vertical length of dendrogam indicates the similarity between two datasets. (C) Comparison of HLA-A expression levels in the three tumor tissues where clustering patterns based on somatic mutations were different from those based on TCRB repertoire (left) and those in tumors showing the similar clustering patterns (right).

