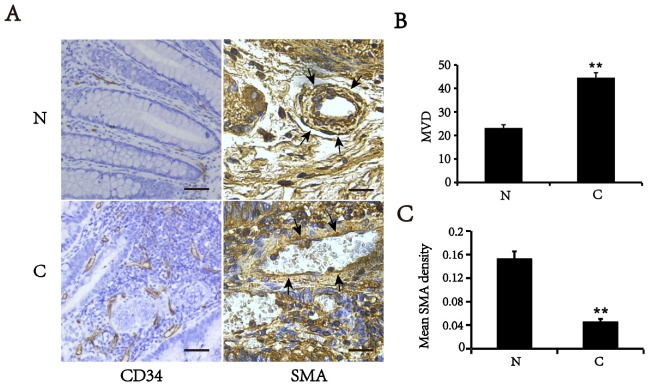
Figure 1. Expression of SMA and CD34 in colorectal cancer (C) and matched normal tissues (N).
(A) Typical images of immunohistochemical staining of SMA and CD34 (Area pointed by arrows). Bars, 50 μm. (B) MVD counts in colorectal cancer and corresponding normal tissues. (C) Mean optical density of SMA in vascular walls. All of values are mean ± SEM from three independent experiments (n=5). **P < 0.01 versus matched normal tissues.

