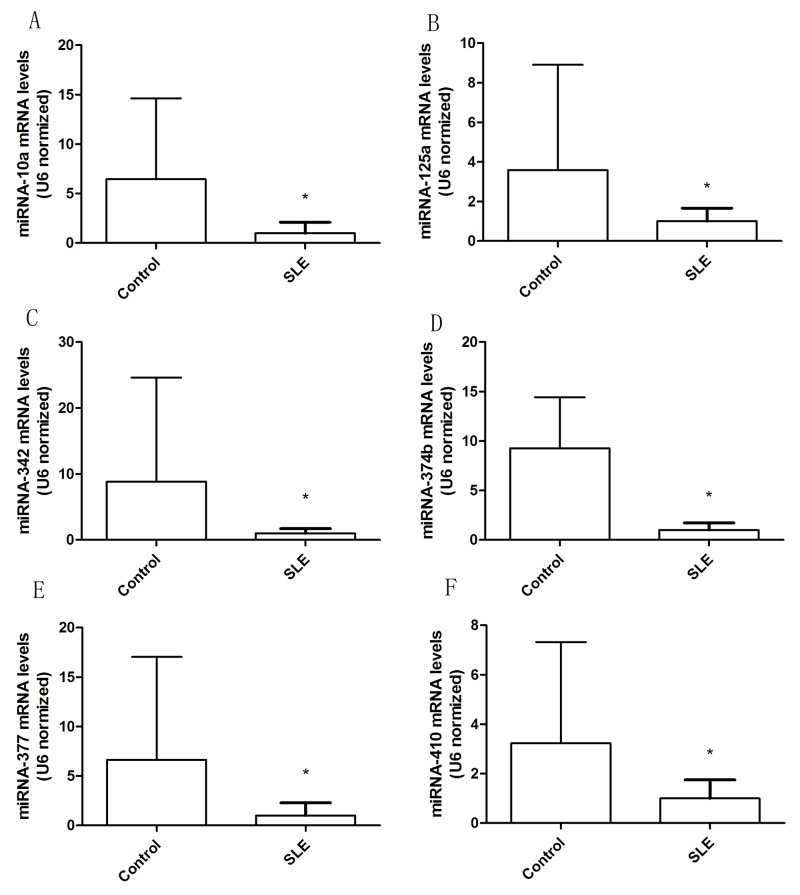
Figure 2. Altered expression of miRNA in T cells from patients with SLE.
The six abnormally expressed miRNAs in T cells were validated by real-time PCR from 42 SLE patients and 48 healthy controls. (A) miRNA-10a levels in T cells from SLE and control groups. (B) miRNA-125a levels in T cells from SLE and control groups. (C) miRNA-342 levels in T cells from SLE and control groups. (D) miRNA-374b levels in T cells from SLE and control groups. (E) miRNA-377 levels in T cells from SLE and control groups. (F) miRNA-410 levels in T cells from SLE and control groups. The error bars represents the standard deviation (SD). * p<0.05 vs con.

