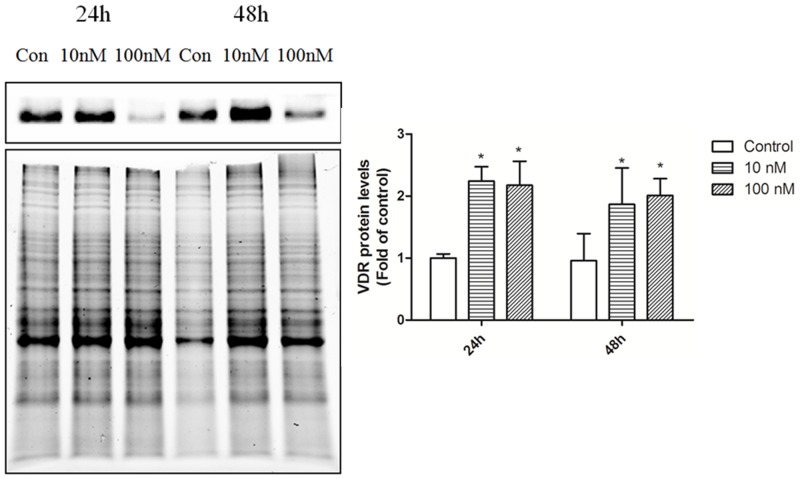
Figure 7. VDR protein expression in T cells from SLE patients.
T cells were treated with control ETOH or 10 nM, 100 nM 1α,25(OH)2D3for 24h and 48h. VDR protein expression was examined by immunoblot analysis. The error bars represents the standard deviation (SD). n=16 for each experiment. * p<0.05 vs con; # p<0.05 100 nM vs 10 nM treatment.

