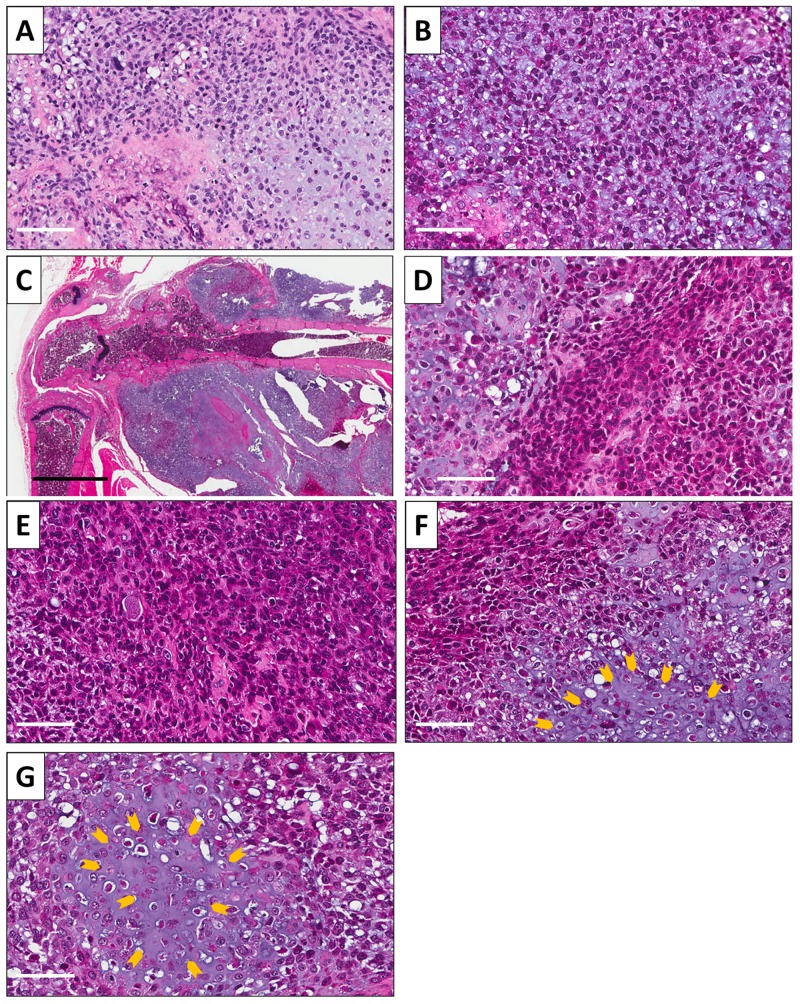
Figure 3. Osteosarcoma histology.
H&E-stained sections of (A) the original patient tumor (micro). (B) Subcutaneously-implanted tumor (micro). (C) Orthotopically-implanted tumor (macro). (D) Orthotopically-implanted tumor (micro). (E) PDOX tumor treated with CDDP. (F) PDOX tumor treated with TRAB. (G) PDOX tumor treated with TEM. Necrotic areas are indicated by yellow arrows. Scale bars: 100 μm for (A, B, D). Black scale bar: 2 mm for C. Scale bars: 80 μm for (E-G).

