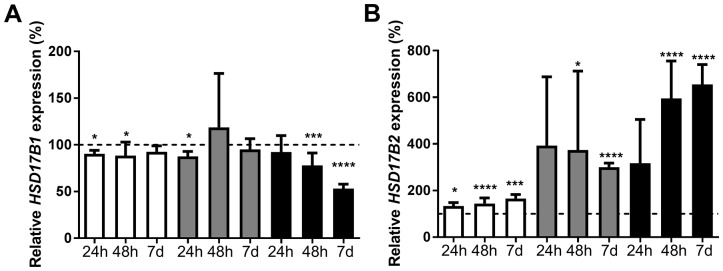
Figure 3.
Relative HSD17B1 (A) and HSD17B2 (B) expression following dihydrotestosterone treatment in ZR-75-1 (white), MCF7 (gray) and T-47D (black), for 24h n=3, 48h n=6, and 7 days n=5. All effects on the relative HSD17B1 and HSD17B2 expression are compared to ethanol-treated controls from the same time point and cell line as the treated sample. Error bars represent standard derivation.

