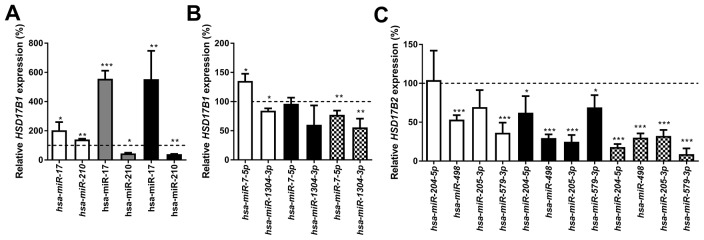
Figure 5.
Relative HSD17B1 (A, B) and HSD17B2 (C) following miRNA treatment for 48 hours. The effects of selected miRNA compared to scrambled miRNA control in the same cell line is shown in ZR-75-1 (white), MCF7 (gray), T-47D (black), and MCF10A (Checkered). n=3. Error bars represent standard derivation.

