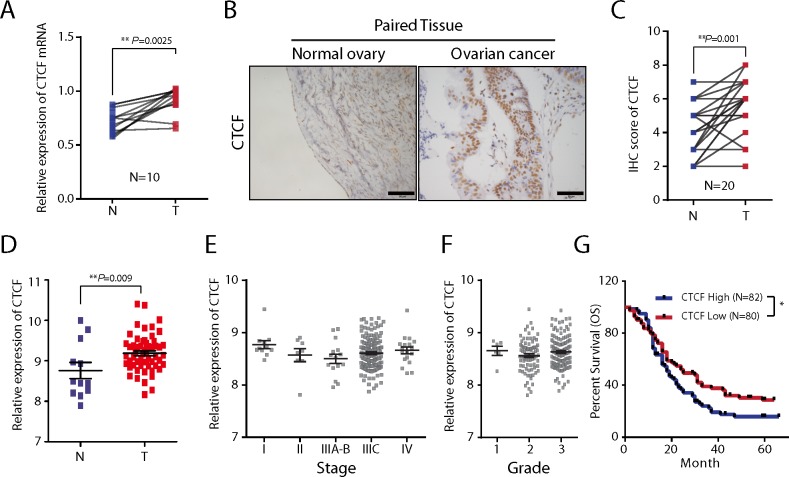
Figure 1. The expression and clinical significance of CTCF in ovarian cancer.
(A) CTCF mRNA expression in ovarian cancer tissues and the paired normal tissues from 10 patients was determined by qPCR analysis. Actin beta (ACTB) was used as a reference gene. N, normal tissue; T, tumor tissue. (B) CTCF protein expression was examined by IHC analysis in ovarian cancer tissues and paired normal tissues from 20 patients. Representative images are shown (scale bar, 50 μm). (C) The results of the CTCF IHC analysis (B) were scored as described in Materials and methods. The IHC scores were analyzed by paired t-test. N, normal tissue; T, tumor tissue. (D) The relative CTCF mRNA expression level was analyzed in 57 ovarian cancer samples and 12 non-tumor samples obtained from the GEO database (GSE66957). (E-F) A comparison of the relative expression levels of CTCF in ovarian cancer patients from the GEO database (GSE9891) with different stages (E) and different grades (F) of the disease. (G) Kaplan–Meier survival curves of ovarian cancer cases derived from the GEO database (GSE13876, We ranked the survival time of 162 tumor-bearing patients according to the CTCF expression levels, then divided them equally into three groups, and compared the survival time between the highest-expression group and the lowest-expression group). Representative data from 3 independent experiments are shown. *P<0.05, **P<0.01.

