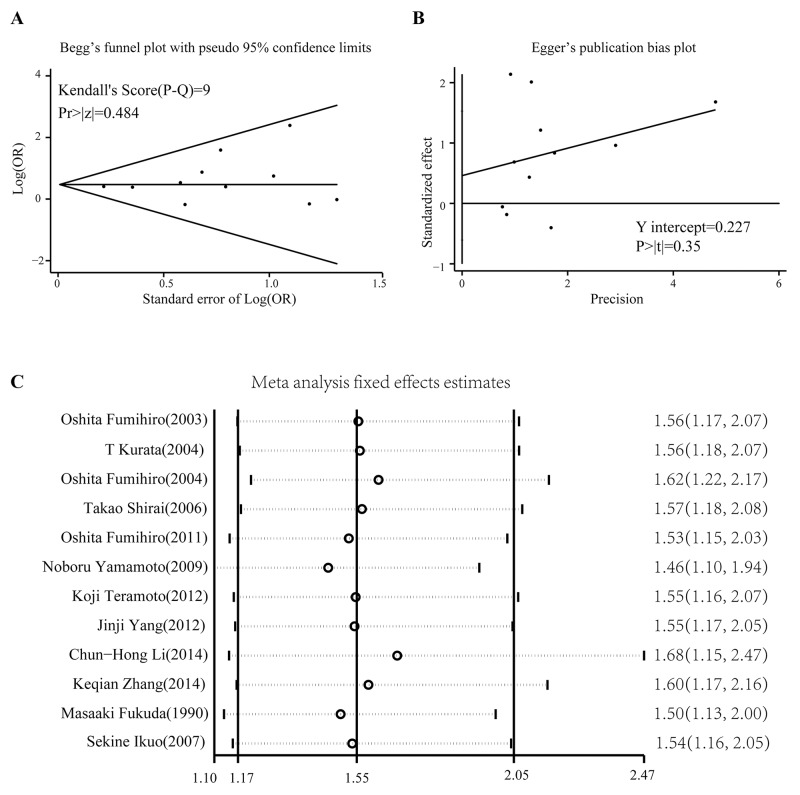
Figure 4. Publication bias test and sensitivity analysis.
(A) Begg’s funnel plot for detection of possible publication bias. The limits refer to the pseudo 95% confidence interval. (B) Egger’s publication bias plot also reveals no publication bias. (C) Effect of each study on the overall OR analyzed using a recessive model (squamous cell lung cancer vs non-squamous cell lung cancer).

