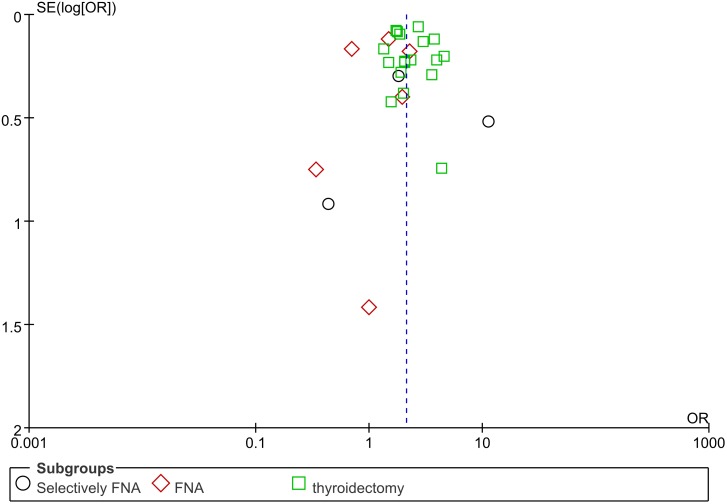
Figure 5. Funnel plot for publication bias in studies comparing the rate of PTC between HT and non-HT.
PTC, papillary thyroid carcinoma; HT, Hashimoto’s thyroiditis; FNA, fine-needle aspiration. Note: The black circles indicate selective FNA studies, the red rhombuses indicate FNA studies, and the green squares indicate thyroidectomy studies.

