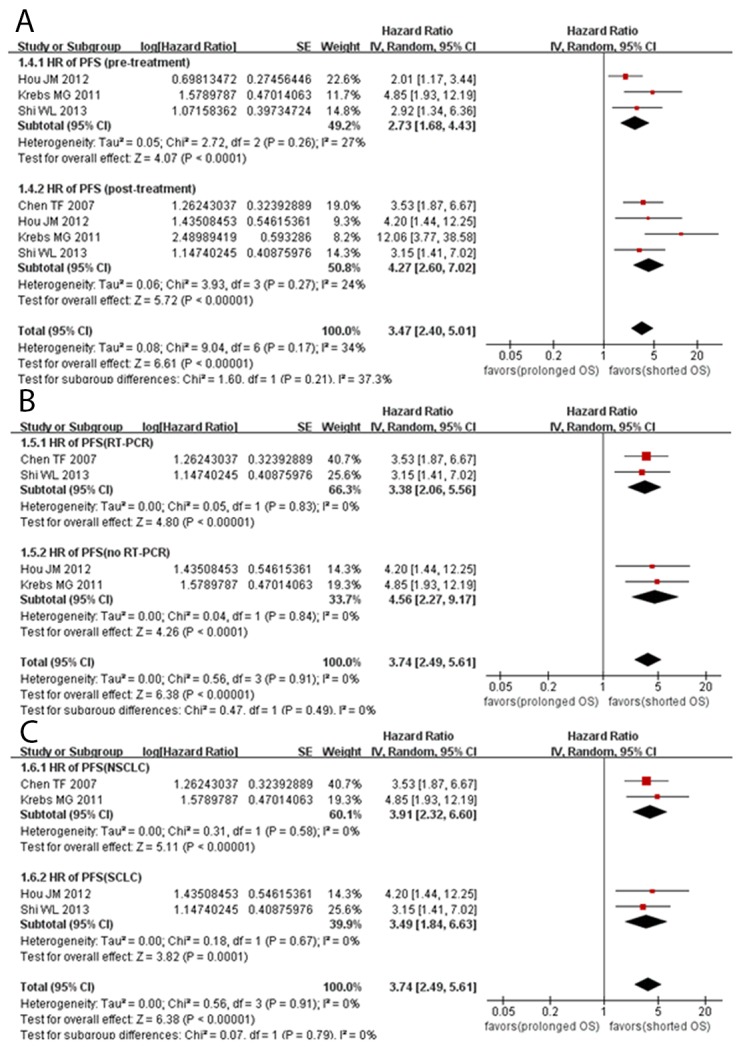
Figure 3. Forest plots evaluating the maximally adjusted association between CTC presence and PFS.

(A) A Forest plot assessing the effect of CTC presence on PFS in subgroups divided by sampling time. (B) A Forest plot assessing the effect of CTC presence on PFS in subgroups divided by detection method. (C) A Forest plot assessing the effect of CTC presence on PFS in subgroups divided by histological type.
