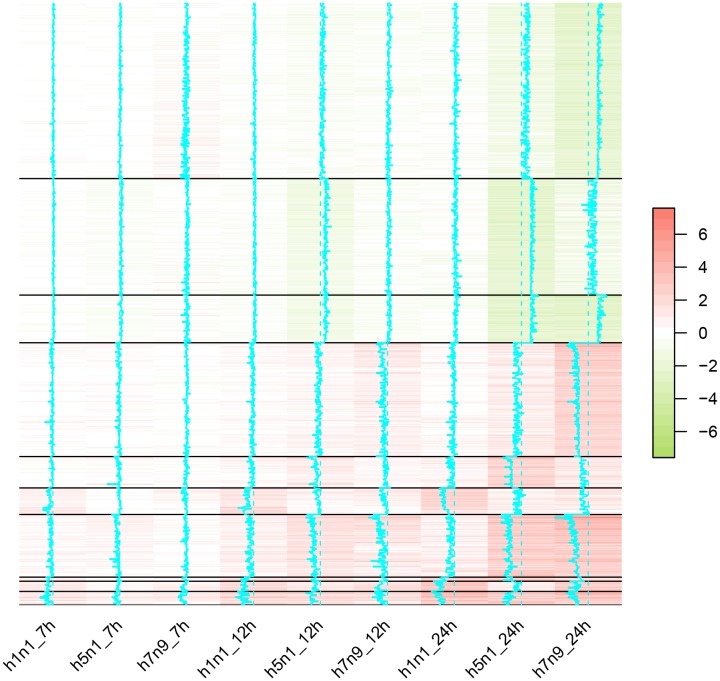
Figure 4. The heatmap of differentially expressed genes in H1N1, H5N1 or H7N9 datasets.
Each column represented one virus strain at a time point and each row represented one differentially expressed genes. The distance of the trace line from the center of each color-cell is proportional to the size of the measurement. Different clustering of genes were separated by the solid black lines.

