. 2017 Sep 12;6:e27421. doi: 10.7554/eLife.27421

Figure 10. Effect of auxin on the expression patterns of REV and KAN1 in the inflorescence meristem.

(A and B) Confocal projections of the IMs showing expression pattern of REV-2 × YPet (red), KAN1−2 × GFP (green) and PIN1-CFP (blue) before (A) and 15 hr after the combined application of 5 mM NAA and 100 μM NPA (B). Primordium (P) and incipient primordium (i) stages are numbered from i3-P2 based on convention described in (Heisler et al., 2005). Note up regulation and expansion of REV expression 15 hr after the combined application of NAA and NPA (n = 6). (C and D) Longitudinal optical sections along the dashed white lines in (A) and (B) respectively. Note the presence of REV expression in the epidermal cells marked by arrowheads in (D) and a corresponding absence or weak level of expression in (C). Similar colored arrowheads mark the same cells tracked over 15 hr. (E and F) Magnified views of the surface of i1, outlined by dotted rectangles in (A and B) showing expression pattern of REV-2 ×YPet (red), KAN1−2 × GFP (green) and PIN1-CFP (blue) before (E) and 15 hr after the combined application of 5 mM NAA and 100 μM NPA (F). Note the presence of REV in the cells marked by arrowheads in (F) and their absence in (E). Similar colored arrowheads mark the same cells tracked over 15 hr in (E and F). (G and H) Same as (E and F) but showing REV and KAN1 expression only. Note the presence of a gap between REV and KAN1 expression in (G) but its absence in (H), marked by white arrowheads in (G and H). (I–L) Confocal projections of IMs showing expression of REV-2 ×YPet (red), KAN1−2 × GFP (green) and PIN1-CFP (blue) before (I) and 48 hr after the combined application of 5 mM NAA and 100 μM NPA (J), and before (K) and 24 hr after treatment with mock solution (L). Initially for both control and treated meristems, KAN1 expression is absent between the meristem center and P1 (blue arrowheads), i1 (white arrowheads) and i2 (yellow arrowheads) (I and K). Under mock treatment, KAN1 expression appears in all three corresponding regions (marked by the same arrowheads) 24 hr later (L). However for the meristem treated with NAA and NPA, KAN1 expression is absent in regions previously corresponding to i1 (white arrowheads) and i2 (yellow arrowheads) but not P1 (blue arrowheads), even after 48 hr (J). Scale bars 20 μm (A–D, I–L) and 10 μm (E–H).

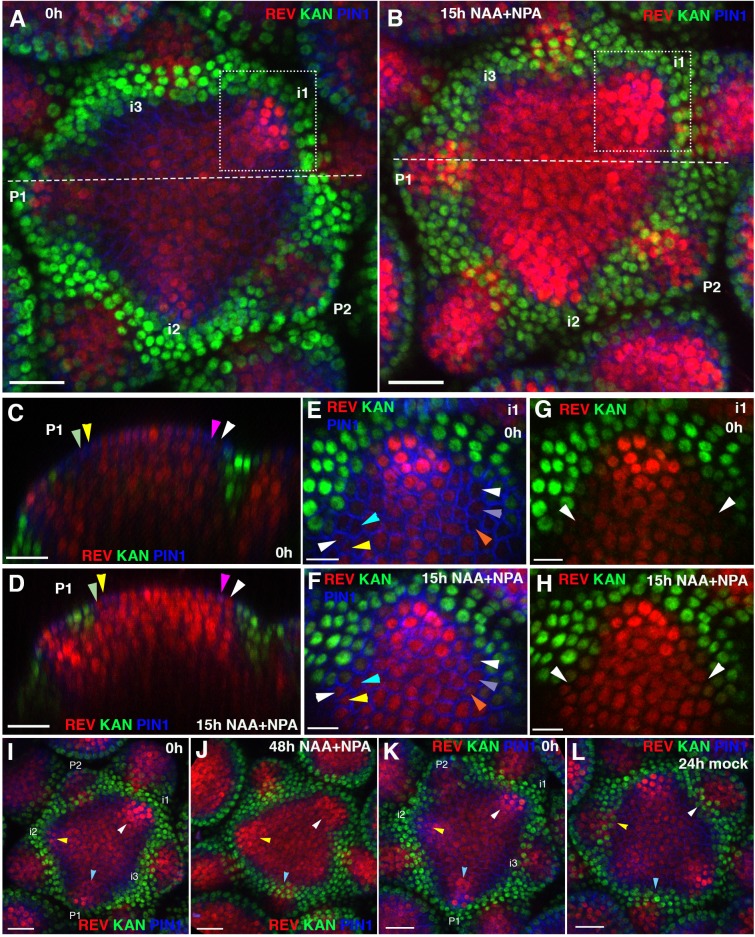
Figure 10.

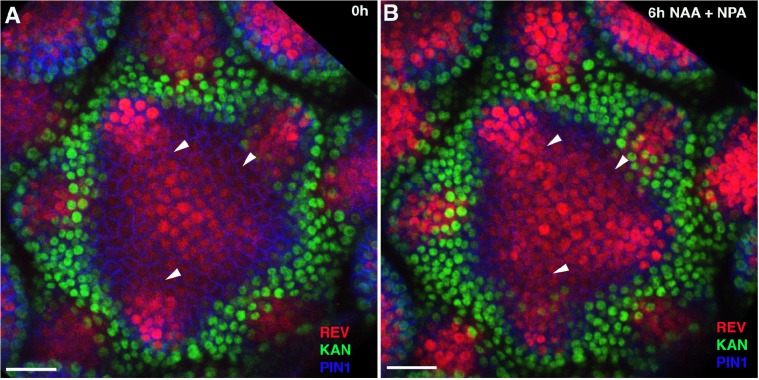
Figure 10—figure supplement 1. REV expression starts to expand within 6 hr of auxin treatment.

Figure 10—figure supplement 1.

(A and B) Confocal projections of the IMs showing expression pattern of REV-2 × YPet (red), KAN1−2 × GFP (green) and PIN1-CFP (blue) before (A) and 6 hr after the combined application of 5 mM NAA and 100 μM NPA (B). Note a slight increase and expansion in REV expansion at positions marked by white arrowheads in (B) compared to (A) (n = 4). Scale bars 20 μm (A and B).
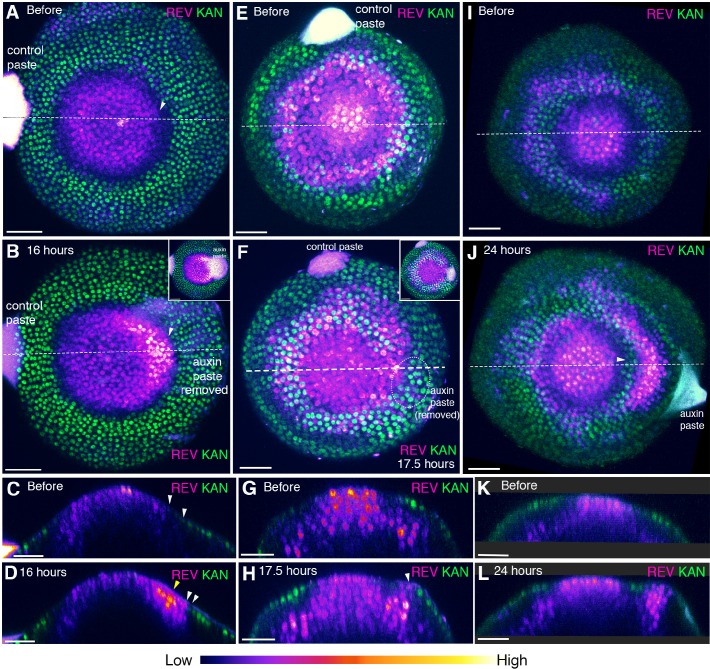
Figure 10—figure supplement 2. Auxin modulates the expression of REV and KAN1 locally.

Figure 10—figure supplement 2.

(AL) Three examples of pin1-4 mutant meristems showing changes in REV-2 × VENUS (magenta) and KAN1−2 × GFP (green) expression in response to local auxin application (arranged according to developmental stage). (A and B) Confocal projections of pin1-4 meristem showing pattern before (A) and 16 hr after local auxin application (B). We have used an intensity color code to better show local differences in REV-2 ×VENUS expression levels. Note local up-regulation and extension of REV at the site of auxin paste application (white arrowhead, paste was removed to visualize the expression pattern at the site of application). Inset in (B) shows view from above prior to removal of paste. (C and D) Longitudinal optical sections along the dashed white lines in (A) and (B) respectively. Note strong up regulation of REV at the site of auxin paste application (yellow arrowhead in (D) and the presence of a gap between REV and KAN1 expression (white arrowheads) prior to local auxin application (C) and reduction in this gap due to REV expansion in (D) (n = 5/6). (E and F) Confocal projections showing pattern before (E) and 17.5 hr after local auxin application (F). Inset in (F) shows view prior to removal of paste. (G and H) Longitudinal optical sections along the dashed white lines in (E) and (F) respectively. Note the extension of REV into the developing primordium (white arrowhead in (H)). (I and J) Confocal projections showing pattern before (I) and 24 hr after local auxin application (J). Note the local pattern of both REV and KAN1 expression induced at the site of auxin application (white arrowhead in (J)). (K and L) Longitudinal optical sections along the dashed white lines in (I) and (J) respectively. Note REV expression in the center of the organ primordium surrounded by KAN expression on both the sides (L) (n = 3). Scale bars 40 μm (A and B), 30 μm (C and D, E–L).
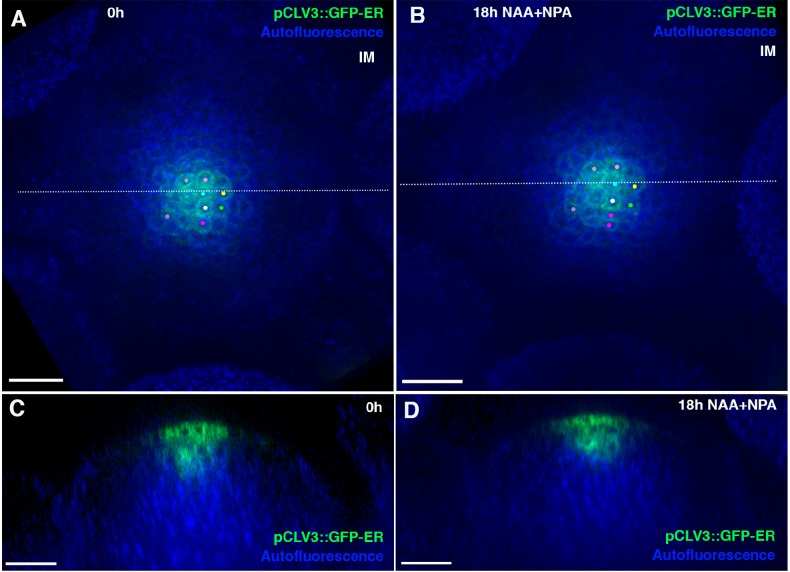
Figure 10—figure supplement 3. Auxin application does not expands CLAVATA3 expression and hence, the central zone of the meristem.

Figure 10—figure supplement 3.

(A and B) Confocal projections of IM showing expression of pCLAVATA3::GFP-ER (green) before (A) and 18 hr after combined application of NAA and NPA. Cells expressing GFP-ER have been tracked using similar colored dots over 18 hr (A and B). (C and D) Longitudinal optical sections along the dashed white lines in (A) and (B) respectively. Note no significant expansion in CLAVATA3 expression (B and D) 18 hr after auxin application (n = 4). Scale bars 20 μm (A–D).