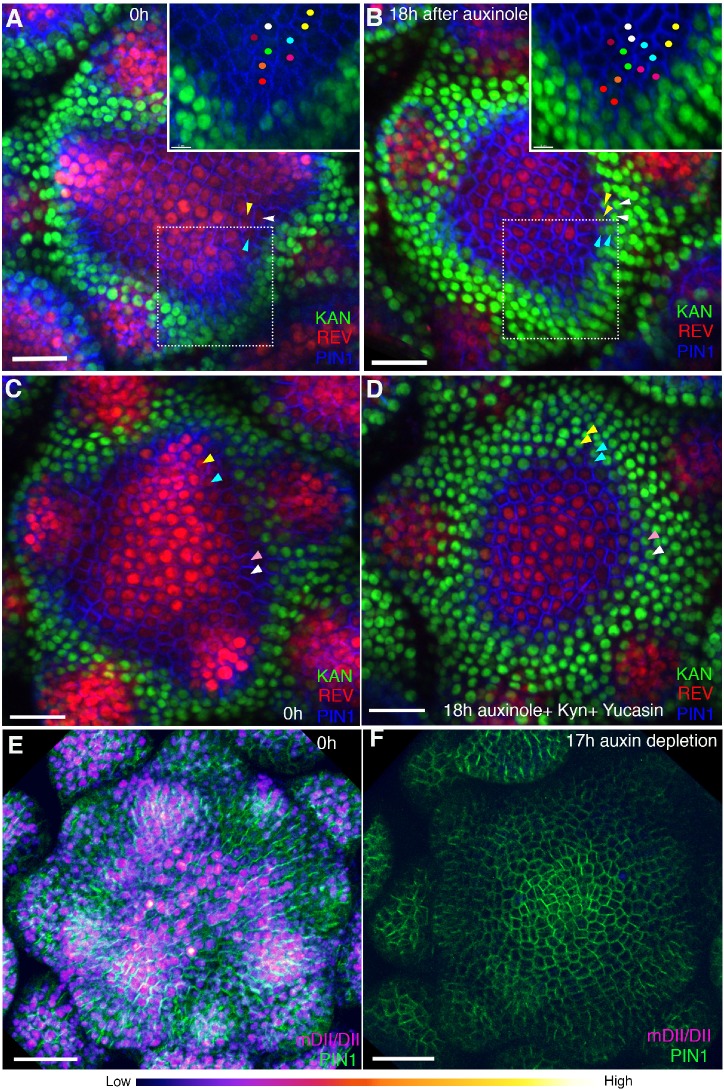
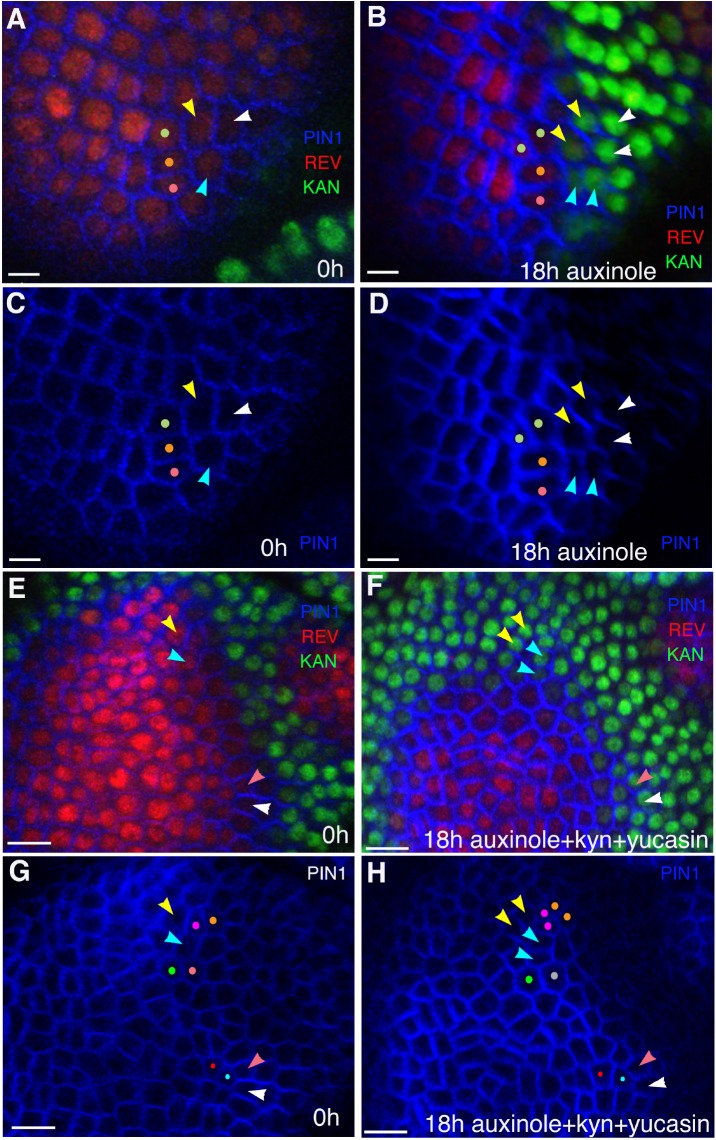
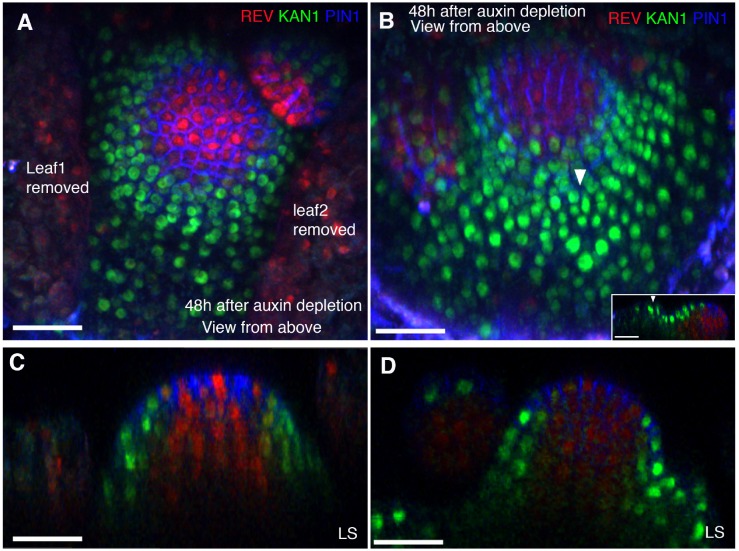
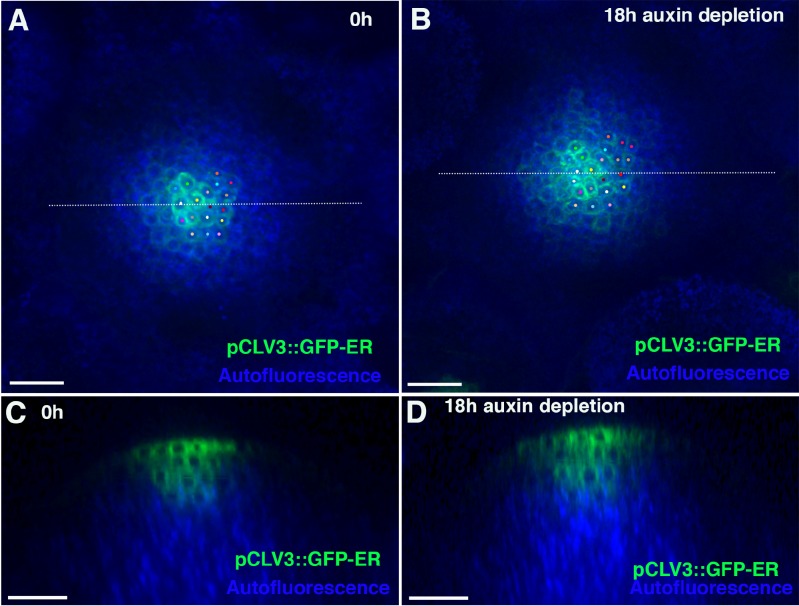
Figure 12. Auxin depletion alters boundary position.
(A and B) Confocal projections of the IMs showing expression pattern of REV-2 × YPet (red), KAN1−2 × GFP (green) and PIN1-CFP (blue) before (A) and 18 hr (B) after the application of 100 μM auxinole. Inset shows close-up of the primordium outlined with the dotted rectangle. Similar colored dots mark the same cells at 0 hr and 18 hr time-points. Note the presence of KAN1 expression in the proximity of the cells marked with colored dots in the inset in (A) and its absence in the inset in (B). Similar color arrowheads in (A and B) mark the same cells that showed REV expression at 0 hr but KAN1 expression at 18 hr after treatment with auxinole. (C and D) Confocal projections of the IMs showing expression pattern of REV-2 × YPet (red), KAN1−2 × GFP (green) and PIN1-CFP (blue) before (C) and 18 hr (D) after the combined application of 100 μM auxinole, 100 μM KYN and 100 μM Yucasin (auxin depleting drugs). Note KAN-2 ×GFP expression has expanded centrally at the expense of REV-2 × YPet expression (compare the cells marked by arrowheads in (C) with (D), similar colored arrowheads mark the same cells tracked over 18 hr) (n = 6/6). (E and F) Confocal projections of the IMs indicating the predicted auxin distribution (magenta) based on R2D2 expression along with PIN1-GFP expression (green) before (E) and 17 hr after the combined application of 100 μM auxinole, 100 μM kyn and 100 μM yucasin (auxin depleting drugs) (F). Note lack of detectable auxin based on R2D2 expression in (F) compared to (E) after the combined drug application (n = 3/4). Scale bars 20 μm (A–D), 30 μm (E and F).


