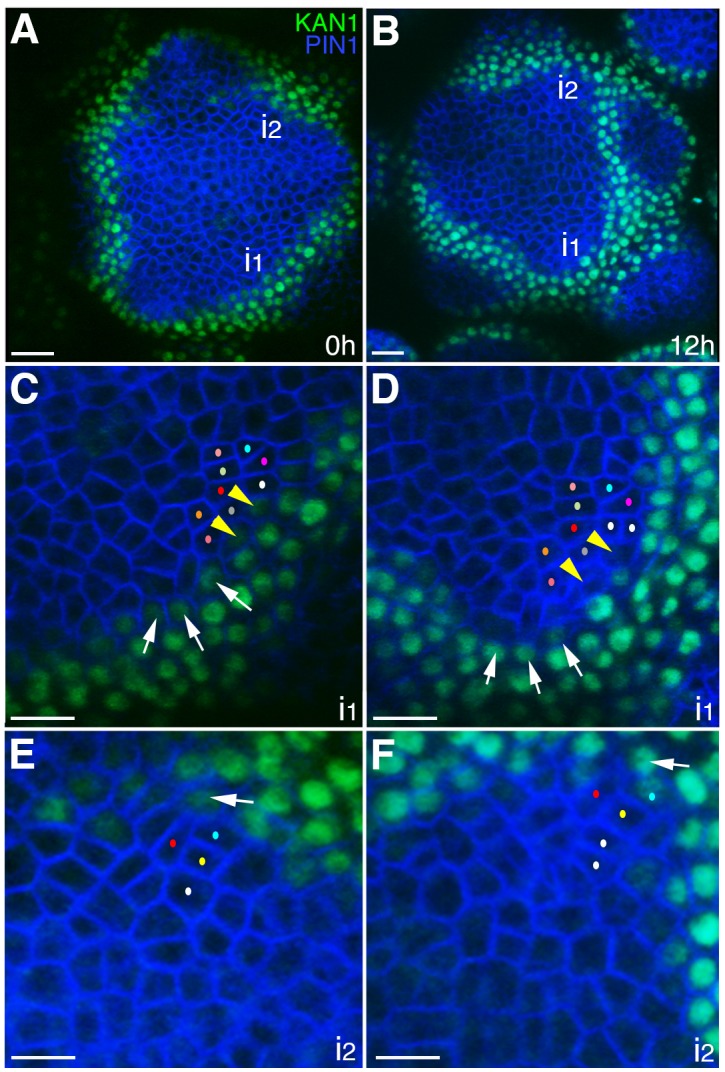
Figure 2. The expression of KAN1−2 × GFP is relatively stable with respect to the underlying cells within initiating organs.

(A–B) Confocal projections showing an inflorescence meristem viewed from above expressing PIN1-CFP (blue) and KAN1−2 × GFP (green) at two time points (0 hr and 12 hr). Two incipient primordia are marked i1 and i2. (C–D) Close up views corresponding to primordium i1 from (A) and (B) with white arrows marking three cells at the edge of KAN1−2 × GFP expression that retain this expression over the time interval. Yellow arrow heads mark two cells in which KAN1−2 × GFP is absent at 12 hr. Similar colored dots mark the same cells in (C) and (D), tracked over 12 hr. (E) Close up view of primordium I2 in (A) with arrow marking adaxial edge of KAN1 expression. (F) Close up of primordium I2 in (B) showing the same cell marked in (E) remaining at the adaxial edge of KAN1 expression after 12 hr. Similar colored dots mark the same cells in (E) and (F), tracked over 12 hr. Scale bars, 20 μm in (A and B); 10 μm in (C–F).
