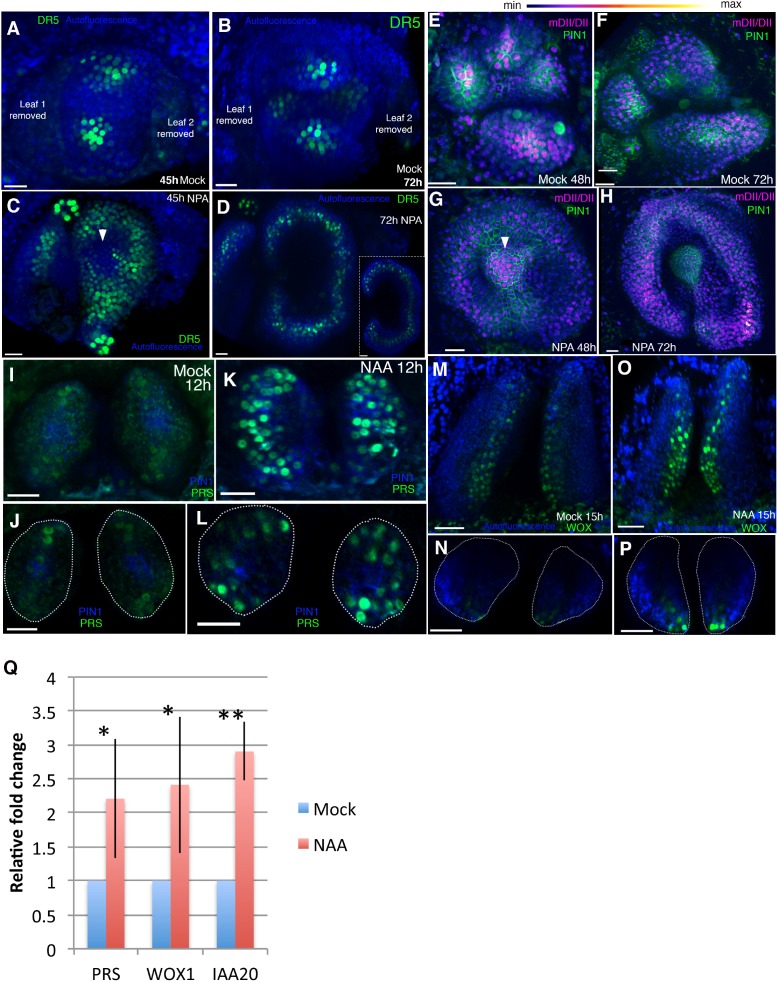
Figure 8. Auxin promotes PRS and WOX expression.
(A–D) Response of pDR5V2−3 × VENUS-N7 (green) auxin transcriptional reporter to NPA in Arabidopsis seedlings treated at 3DAS (Days after Stratification). (A and B) Confocal projections 45 hr (A) and 72 hr (B) after treatment with mock solution. (C and D) Confocal projections 45 hr (C) and 72 hr (D) after treatment with 100 μM NPA solution (n = 5/5). White arrowhead in (C) marks absence of DR5 reporter in the center of the meristem. Inset in (D) shows transverse optical section through the ring-shaped organ showing most DR5 expression localized in the center of the organ. (E–H) Expression and response of R2D2 (magenta) to auxin along with PIN1-GFP expression (green) in Arabidopsis seedlings treated at 3DAS. (E and F) Confocal projections 48 hr (E) and 72 hr (F) after treatment with mock solution. (G and H) Confocal projections 48 hr (G) and 72 hr (H) after treatment with 100 μM NPA solution (n = 4/4). White arrowhead in (G) marks the presence of auxin in the meristem center (compare with (C) which shows absence of auxin signaling in the meristem center). (I–L) Expression and response of pPRS:: PRS-2 ×GFP to auxin in Arabidopsis seedlings. Confocal projections and transverse optical slices of seedlings 4DAS showing of pPRS:: PRS-2 ×GFP expression (green) 12 hr after treatment with mock solution (I and J) and 5 mM NAA (K and L) (n = 5/5). (M–P) Expression and response of 2 × GFP WOX to auxin in Arabidopsis seedlings. (M and N) Confocal projections (M and O) and corresponding optical slices (N and P) of seedlings 4DAS showing pWOX1::2 × GFP-WOX1 expression (green) 12 hr after treatment with mock solution (M and N) and 5 mM NAA (O and P). Note WOX expression increases but does not expand beyond its regular expression domain upon auxin addition (n = 5/5). (Q) Q-PCR analysis of PRS, WOX1 and positive control IAA20 transcripts after 5 mM NAA or mock treatment on 4 days old wild-type (Ler) seedlings. *=p < 0.05, **=p < 0.001. Scale bars 20 μm (A–I, K); 15 μm (J and L); 30 μm (M–P).

