. 2017 Sep 12;6:e28409. doi: 10.7554/eLife.28409

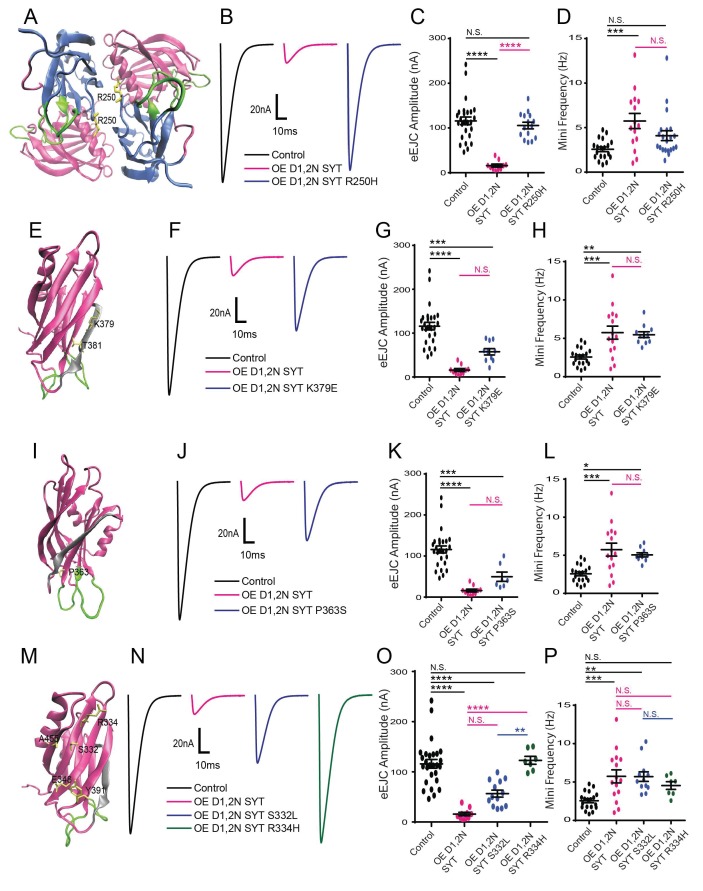
Figure 2. Characterization of suppressor mutation effects on DN Syt1C2BD1,2N physiology.

(A) Location of the R250 residue (yellow) in C2A at the Syt1 dimer interface. (B) Representative eEJCs recorded in 0.2 mM extracellular Ca2+ in control (black), elavC155-GAL4; UAS-Syt1C2BD1,2N (OE D1,2N SYT, magenta) and elavC155-GAL4; UAS-Syt1C2BD1,2N R250H (OE D1,2 N SYT R250H, blue). (C) Quantification of mean eEJC amplitude for the indicated genotypes: control, 116.0 ± 8.7 nA, n = 27; OE D1,2N Syt1, 15.9 ± 3.5 nA, n = 10; OE D1,2 N Syt1 R250H, 105.5 ± 7.5 nA, n = 15. (D) Quantification of average mini frequency for the indicated genotypes: control, 2.6 ± 0.3 Hz, n = 19; OE D1,2N Syt1, 5.7 ± 0.8 Hz, n = 15; OE D1,2N Syt1 R250H, 4.1 ± 0.6 Hz, n = 21. (E) Location of the K379 and T381 residues (yellow) in the C2B polybasic β-strand (grey). (F) Representative eEJCs recorded in 0.2 mM extracellular Ca2+ in control (black), elavC155-GAL4; UAS-Syt1C2BD1,2N (OE D1,2N SYT in magenta) and elavC155-GAL4; UAS-Syt1C2BD1,2N K379E (OE D1,2N SYT K379E, blue). (G) Quantification of mean eEJC amplitude in the indicated genotypes: control, 116.0 ± 8.7 nA, n = 27; OE D1,2N Syt1, 15.9 ± 3.5 nA, n = 10; OE D1,2N Syt1 K379E, 57.7 ± 7.3 nA, n = 10. (H) Quantification of average mini frequency for the indicated genotypes: control, 2.6 ± 0.3 Hz, n = 19; OE D1,2N Syt1, 5.7 ± 0.8 Hz, n = 15; OE D1,2N Syt1 K379E, 5.5 ± 0.4 Hz, n = 11. (I) Location of the P363 residue (yellow) near the C2B Ca2+ binding loops (green). (J) Representative eEJCs recorded in 0.2 mM extracellular Ca2+ in control (black), elavC155-GAL4; UAS-Syt1C2BD1,2N (OE D1,2N SYT, magenta) and elavC155-GAL4; UAS-Syt1C2BD1,2N K379E (OE D1,2N SYT P363S, blue). (K) Quantification of mean eEJC amplitude in the indicated genotypes: control, 116.0 ± 8.7 nA, n = 27; OE D1,2N Syt1, 15.9 ± 3.5 nA, n = 10; OE D1,2N Syt1 P363S, 49.6 ± 11.2 nA, n = 7. (L) Quantification of average mini frequency for the indicated genotypes: control, 2.6 ± 0.3 Hz, n = 19; OE D1,2N Syt1, 5.7 ± 0.8 Hz, n = 15; OE D1,2N Syt1 P363S, 5.1 ± 0.3 Hz, n = 10. (M) Location of the S332, R334, E348, Y391, and A455 residues (yellow) on the C2B surface opposite to the polybasic β-strand (grey). (N) Representative eEJCs recorded in 0.2 mM extracellular Ca2+ in control (black), elavC155-GAL4; UAS-Syt1C2BD1,2N (OE D1,2N SYT, magenta), elavC155-GAL4; UAS-Syt1C2BD1,2N S332L (OE D1,2N SYT S332L, blue) and elavC155-GAL4; UAS-Syt1C2BD1,2N R334H (OE D1,2N SYT R334H, green). (O) Quantification of mean eEJC amplitude in the indicated genotypes: control, 116.0 ± 8.7 nA, n = 27; OE D1,2N Syt1, 15.9 ± 3.5 nA, n = 10; OE D1,2N Syt1 S332L, 56.6 ± 7.0 nA, n = 13; OE D1,2N Syt1 R334H, 122.9 ± 7.8 nA, n = 7. (P) Quantification of average mini frequency for the indicated genotypes: control, 2.6 ± 0.3 Hz, n = 19; OE D1,2N Syt1, 5.7 ± 0.8 Hz, n = 15; OE D1,2N Syt1 S332L, 5.7 ± 0.6 Hz, n = 12; OE D1,2N Syt1 R334H, 4.5 ± 0.5 Hz, n = 7. Statistical significance was determined using one-way ANOVA (nonparametric) with post hoc Sidak’s multiple comparisons test. N.S. = no significant change, *p<0.05, **=p<0.005, ***=p<0.0005, ****=p<0.0001. All error bars are SEM.

Figure 2—source data 1. Sample size (n), mean, SEM, and One-way Anova (and nonparametric) Turkey's multiple comparisons test are presented for the data in Figure 2—figure supplement 2C,D,F,G,I,J,L,M.
DOI: 10.7554/eLife.28409.011

Figure 2.

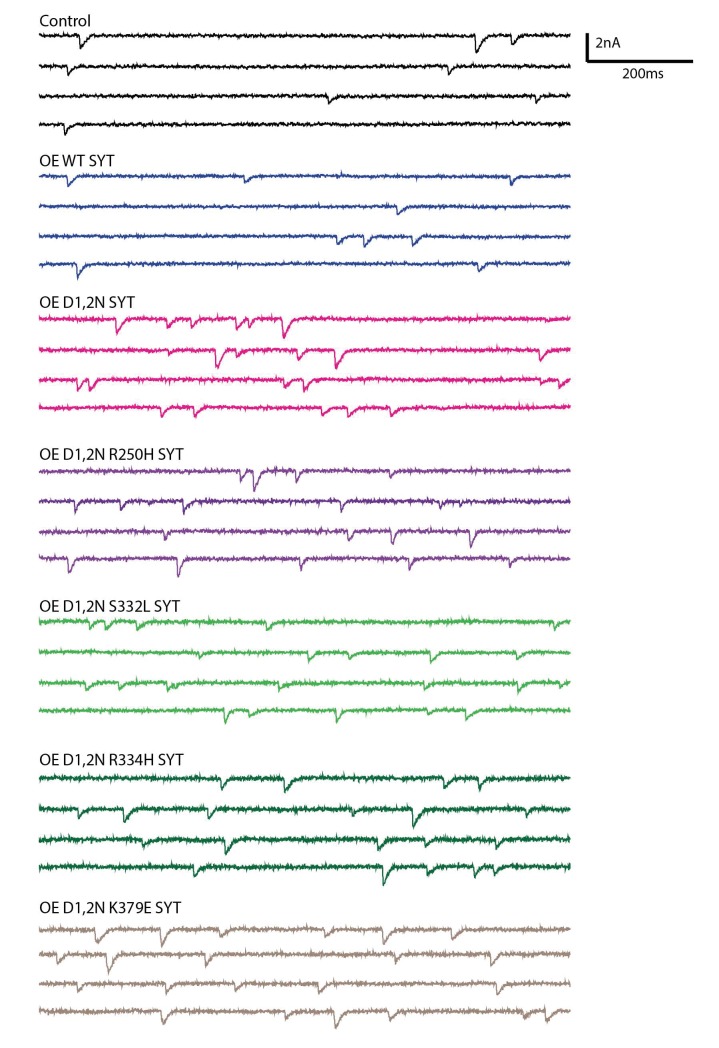
Figure 2—figure supplement 1. Postsynaptic current recordings of spontaneous release at third instar larval muscle 6 synapses in controls and in larvae overexpessing the indicated Syt1 transgenic protein by elav-GAL4 in HL3.1 saline.

Figure 2—figure supplement 1.

Scale bar: 2 nA, 200 ms.
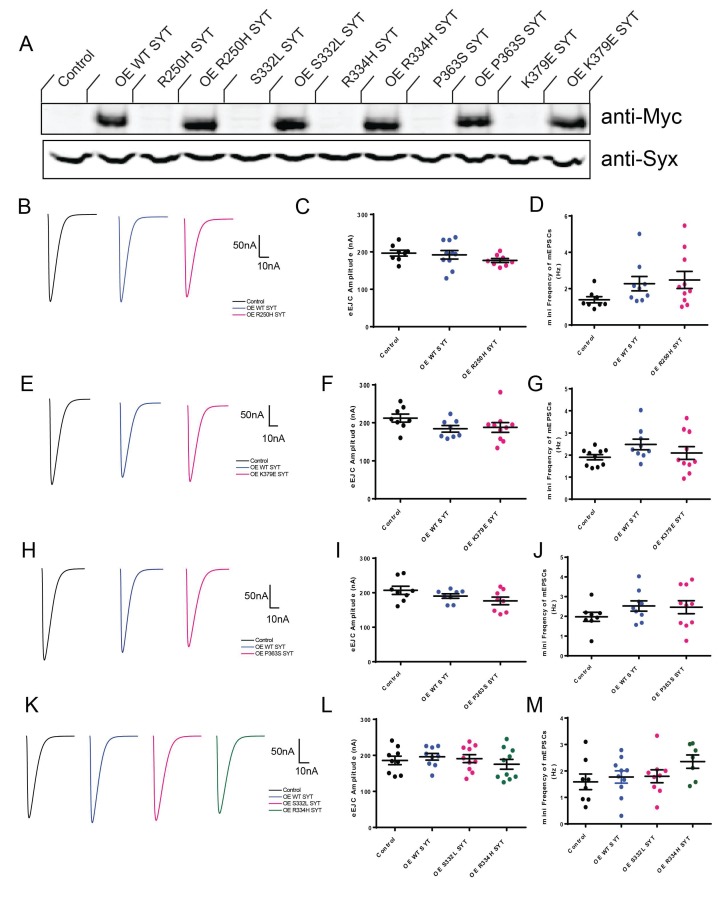
Figure 2—figure supplement 2. Characterization of the effects of mutant overexpression in the wildtype background.

Figure 2—figure supplement 2.

(A) Western Blot of overexpressed Syt1 mutant proteins in head extracts of elavC155-GAL4; UAS-WT-Myc SYT (OE WT SYT), control elavC155-GAL4 without UAS (Control); elavC155-GAL4; UAS-R250H-Myc SYT (OE R250H SYT) and control UAS-R250H-Myc SYT without a driver (R250H SYT); elavC155-GAL4; UAS-S332L-Myc SYT (OE S332L SYT) and control UAS-S332L-Myc SYT without a driver (S332L SYT); elavC155-GAL4; UAS-R334H-Myc SYT (OE R334H SYT) and control UAS-R334H-Myc SYT without a driver (R334H SYT); elavC155-GAL4; UAS-P363S-Myc SYT (OE P363S SYT) and control UAS-P363S-Myc SYT without a driver (P363S SYT); elavC155-GAL4; UAS-K379E-Myc SYT (OE K379E SYT) and control UAS-K379E-Myc SYT without a driver (K379E SYT). The top panel shows anti-Myc immunoreactivity, while the bottom panel shows anti-Syntaxin (anti-Syx) immunoreactivity as a loading control. (B) Representative eEJCs recorded in 0.8 mM extracellular Ca2+ in control (black), elavC155-GAL4; UAS-WT-Myc SYT (OE WT SYT, blue) and elavC155-GAL4; UAS-R250H-Myc SYT (OE R250H SYT, magenta). (C) Quantification of mean eEJC amplitude for the indicated genotypes: control, 196.7 ± 7.8 nA, n = 8; OE WT SYT, 192.2 ± 11.4 nA, n = 10; OE R250H SYT, 177.0 ± 5.3 nA, n = 8. (D) Quantification of average mini frequency for the indicated genotypes: control, 1.4 ± 0.2 Hz, n = 8; OE WT SYT, 2.5 ± 0.5 Hz, n = 10; OE R250H SYT, 2.3 ± 0.4 Hz, n = 9. (E) Representative eEJCs recorded in 0.8 mM extracellular Ca2+ in control (black), elavC155-GAL4; UAS-WT-Myc SYT (OE WT SYT, blue) and elavC155-GAL4; UAS-K379E-Myc SYT (OE K379E SYT, magenta). (F) Quantification of mean eEJC amplitude for the indicated genotypes: control, 212.2 ± 10.6 nA, n = 8; OE WT SYT, 184.2 ± 8.4 nA, n = 8; OE K379E SYT, 187.9 ± 12.5 nA, n = 10. (G) Quantification of average mini frequency for the indicated genotypes: control, 1.9 ± 0.1 Hz, n = 10; OE WT SYT, 2.5 ± 0.2 Hz, n = 9; OE K379E SYT, 2.1 ± 0.3 Hz, n = 10. (H) Representative eEJCs recorded in 0.8 mM extracellular Ca2+ in control (black), elavC155-GAL4; UAS-WT-Myc SYT (OE WT SYT, blue) and elavC155-GAL4; UAS-P363S-Myc SYT (OE P363S SYT, magenta). (I) Quantification of mean eEJC amplitude for the indicated genotypes: control, 207.0 ± 11.8 nA, n = 8; OE WT SYT, 190.4 ± 6.5 nA, n = 8; OE P363S SYT, 176.3 ± 11.0 nA, n = 8. (J) Quantification of average mini frequency for the indicated genotypes: control, 2.0 ± 0.2 Hz, n = 8; OE WT SYT, 2.5 ± 0.3 Hz, n = 9; OE P363S SYT, 2.5 ± 0.3 Hz, n = 10. (K) Representative eEJCs recorded in 0.8 mM extracellular Ca2+ in control (black), elavC155-GAL4; UAS-WT-Myc SYT (OE WT SYT, blue), elavC155-GAL4; UAS-S332L-Myc SYT (OE S332L SYT, magenta) and elavC155-GAL4; UAS-R334H-Myc SYT (OE R334H SYT, green). (L) Quantification of mean eEJC amplitude for the indicated genotypes: control, 186.0 ± 11.9 nA, n = 9; OE WT SYT, 196.1 ± 9.2 nA, n = 9; OE S332L SYT, 190.9 ± 11.0 nA, n = 10. OE R334H SYT, 175.3 ± 13.6 nA, n = 10. (M) Quantification of average mini frequency for the indicated genotypes: control, 1.6 ± 0.3 Hz, n = 8; OE WT SYT, 1.8 ± 0.2 Hz, n = 10; OE S332L SYT, 1.8 ± 0.2 Hz, n = 9; OE R334H SYT, 2.4 ± 0.3 Hz, n = 7. Statistical significance was determined using one-way ANOVA (nonparametric) with post hoc Tukey’s multiple comparisons test. N.S. = no significant change (p>0.05). All error bars are SEM.