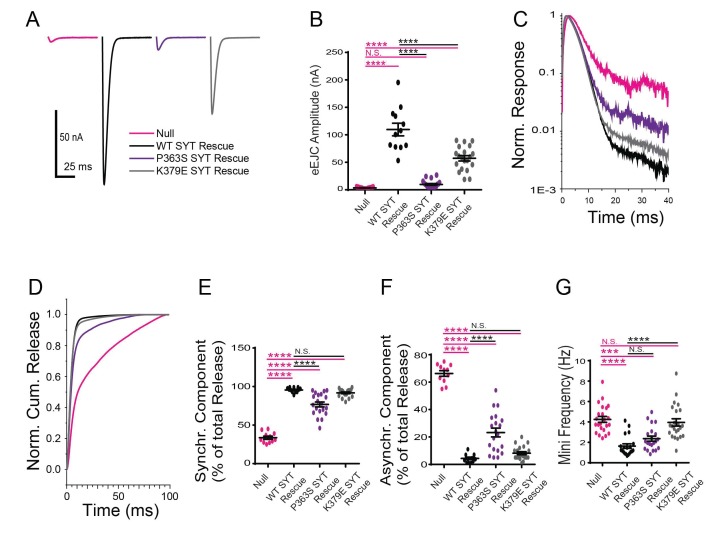
Figure 6. Physiological analysis of the K379E and P363S mutants on neurotransmitter release.
(A) Representative eEJCs recorded in 2.0 mM extracellular Ca2+ in syt1 -/- null larvae (magenta) and null mutants rescued with WT Syt1 (black), P363S Syt1 (purple) or K379E Syt1 (grey). (B) Quantification of mean eEJC amplitude for the indicated genotypes: null, 3.5 ± 0.4 nA, n = 11; WT Syt1 rescue, 109.7 ± 11.5 nA, n = 12; P363S Syt1 rescue, 9.8 ± 1.7 nA, n = 20; K379E Syt1 rescue, 57.3 ± 4.9 nA, n = 20. C. Average normalized responses plotted on a semi-logarithmic graph to display their components. (C) Average normalized responses for each genotype plotted on a semi-logarithmic graph to display release components. (D) Cumulative release normalized for the maximum in 2.0 mM Ca2+ for each genotype. Each trace was adjusted to a double exponential fit. (E) Quantification of the synchronous components of release for each genotype: null, 33.7 ± 2.1%, n = 11; WT Syt1 rescue, 95.6 ± 0.9%, n = 12; P363S Syt1 rescue, 76.8 ± 3.2%, n = 20; K379E Syt1 rescue, 91.8 ± 1.1%, n = 20. (F) Quantification of the asynchronous components of release for each genotype: null, 66.3 ± 2.1%, n = 11; WT Syt1 rescue, 4.4 ± 0.9%, n = 12; P363S Syt1 rescue, 23.2 ± 3.2%, n = 20; K379E Syt1 rescue, 8.2 ± 1.1%, n = 20. (G) Quantification of average mini frequency for the indicated genotypes: null, 4.2 ± 0.3 Hz, n = 23; WT Syt1 rescue, 1.6 ± 0.2 Hz, n = 20; P363S Syt1 rescue, 2.4 ± 0.2 Hz, n = 21; K379E Syt1 rescue, 4.0 ± 0.3 Hz, n = 23. Statistical significance was determined using one-way ANOVA (nonparametric) with post hoc Sidak’s multiple comparisons test. N.S. = no significant change, ***p<0.0005, ****p<0.0001. All error bars are SEM.

