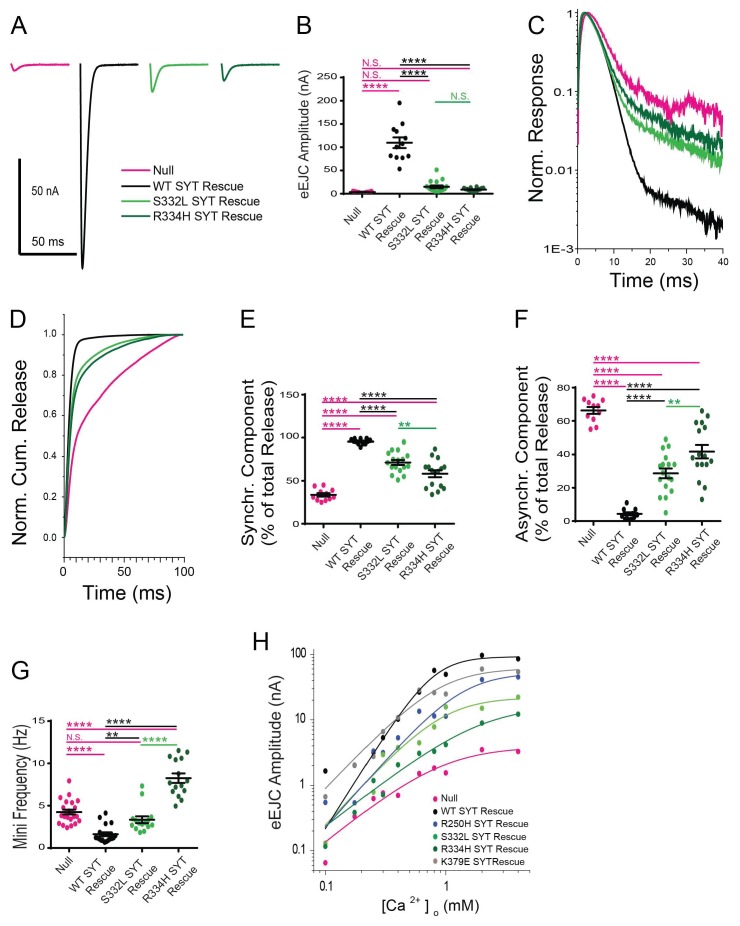
Figure 8. Effects of the S332L and R334H mutations on neurotransmitter release.
(A) Representative eEJCs recorded in 2.0 mM extracellular Ca2+ in syt1 -/- null larvae (magenta) and null mutants rescued with WT Syt1 (black), S332L Syt1 (light green) or R334H Syt1 (dark green). (B) Quantification of mean eEJC amplitudes for the indicated genotypes: null, 3.5 ± 0.4 nA, n = 11; WT Syt1 rescue, 109.7 ± 11.5 nA, n = 12; S332L Syt1 rescue, 14.9 ± 3.0 nA, n = 17; R334H Syt1 rescue, 8.8 ± 0.9 nA, n = 16. (C) Average normalized responses plotted on a semi-logarithmic graph to display their components. (D) Cumulative release normalized for the maximum in 2.0 mM Ca2+ for each genotype. Each trace was adjusted to a double exponential fit. (E) Quantification of the synchronous components of release for each genotype: null, 33.7 ± 2.1%, n = 11; WT Syt1 rescue, 95.6 ± 0.9%, n = 12; S332L Syt1 rescue, 71.3 ± 2.9%, n = 17; R334H Syt1 rescue, 58.3 ± 4.0%, n = 16. (F). Quantification of the asynchronous components of release for each genotype: null, 66.3 ± 2.1%, n = 11; WT Syt1 rescue, 4.4 ± 0.9%, n = 12; S332L Syt1 rescue, 28.7 ± 2.9%, n = 17; R334H Syt1 rescue, 41.8 ± 4.0%, n = 16. (G) Quantification of average mini frequency for the indicated genotypes: null, 4.2 ± 0.3 Hz, n = 23; WT Syt1 rescue, 1.6 ± 0.2 Hz, n = 20; S332L Syt1 rescue, 3.3 ± 0.4 Hz, n = 15; R334H Syt1 rescue, 8.3 ± 0.5 Hz, n = 15). For panels B-G, statistical significance was determined using one-way ANOVA (nonparametric) with post hoc Sidak’s multiple comparisons test. N.S. = no significant change, **=p < 0.01, ****=p < 0.0001. All error bars are SEM. (H) Ca2+ cooperativity of release is shown on a double logarithmic plot, with Hill fit for each genotype. Ten extracellular Ca2+ concentrations (mM) were tested: 0.1, 0.175, 0.25, 0.3, 0.4, 0.6, 0.8, 1, 2, 4. The cooperativity for the genotypes is (value ±standard error): null, 1.5 ± 0.4 (n = 102); WT Syt1 rescue, 2.9 ± 0.7 (n = 119); R250H Syt1 rescue, 2.1 ± 0.6 (n = 112); S332L Syt1 rescue, 2.0 ± 0.6 (n = 112); R334H Syt1 rescue, 1.4 ± 0.2 (n = 112); K379E Syt1 rescue, 1.9 ± 0.6 (n = 118). Regression analysis revealed significant differences in the WT Syt1 rescue (p<0.0001) and R334H Syt1 rescue (p<0.05) compared to null. The R250H Syt1 rescue (p<0.05) and the S332L Syt1 rescue (p<0.0001) were significantly different compared to WT Syt1 rescue. At least 6 recordings were performed in each concentration, with n indicating the total number of recordings in the 10 different Ca2+ concentrations.

