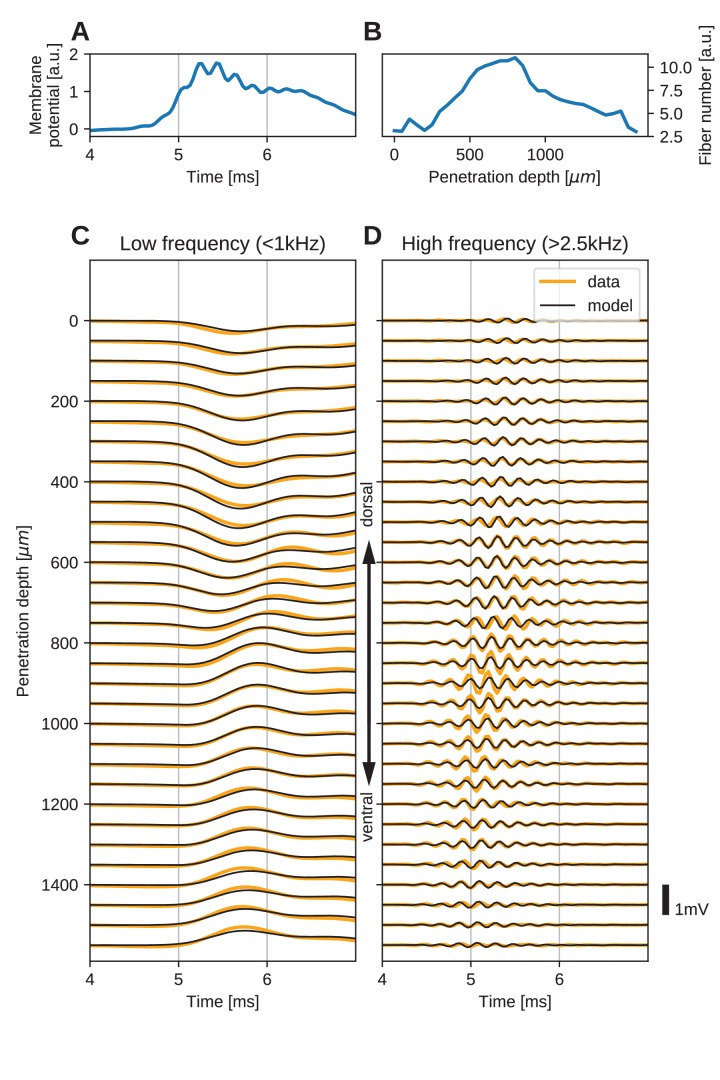
Figure 5. The spatial structure of EFPs recorded from the nucleus laminaris of the barn owl can be explained by a model of axonal field potentials (for details, see Materials and methods).
(A) Membrane voltage, averaged across fibers, in the model when fit to the data. (B) Fitted number of fibers in the model as a function of penetration depth. (C) Low-frequency ( kHz) components of the EFP in response to a click stimulus at time 0 ms, at different recording depths. The depth is measured in the direction from dorsal to ventral. Recorded responses (orange) are shown along with model fits (black). (D) High-frequency ( kHz) responses in recordings (orange) and model (black). Recorded traces were averaged over 10 repetitions.

