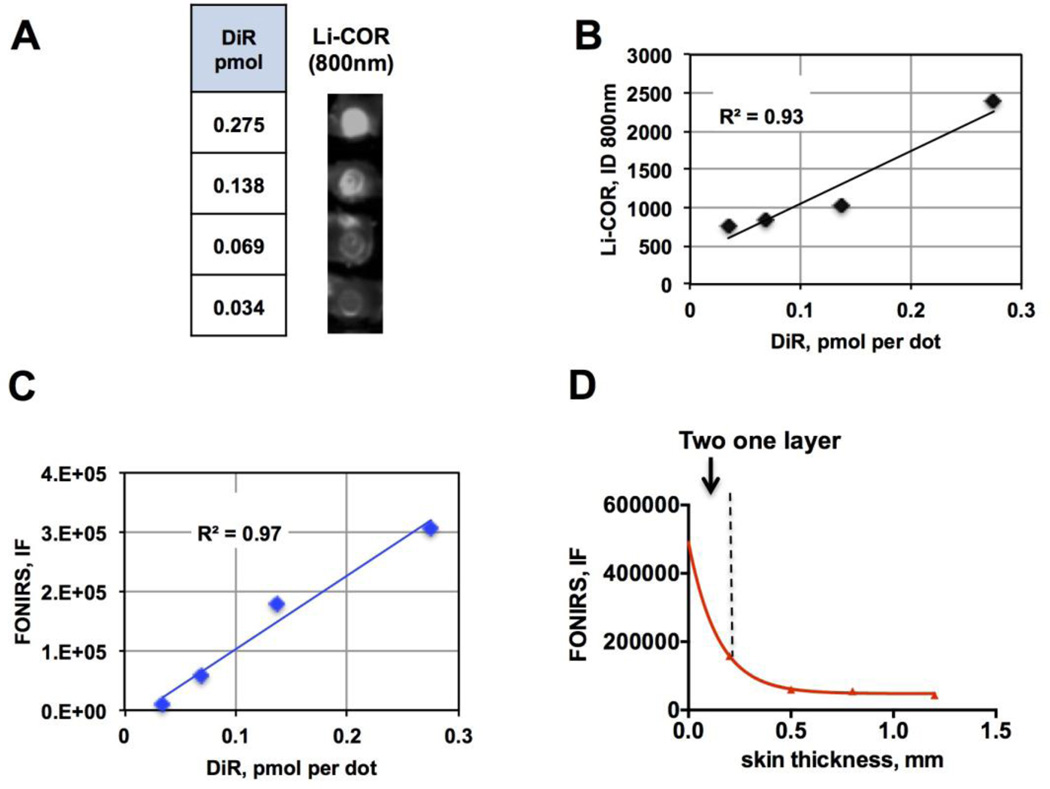
Fig. 2. FONIRS measurements of fluorescence ex vivo.
A) DiR was spotted in different amounts on a nitrocellulose membrane (~5mm dots), and a square piece of depilated mouse skin (epidermis+dermis) was applied over each spot. The image shows a 800nm fluorescence scan (Li-COR) of different DiR amounts per spot with the skin layer on top; B) linear response of fluorescence in the presence of skin scanned with Li-COR. Integrated density of the spots was plotted against DiR amount per spot; C) Linear response of fluorescence in the presence of skin measured with FONIRS; D) Fluorescence of DiR measured with FONIRS over different numbers of mouse skin layers shows exponential decrease of the IF. The data were fitter with Prism software using monoexponential decay curve fit.

