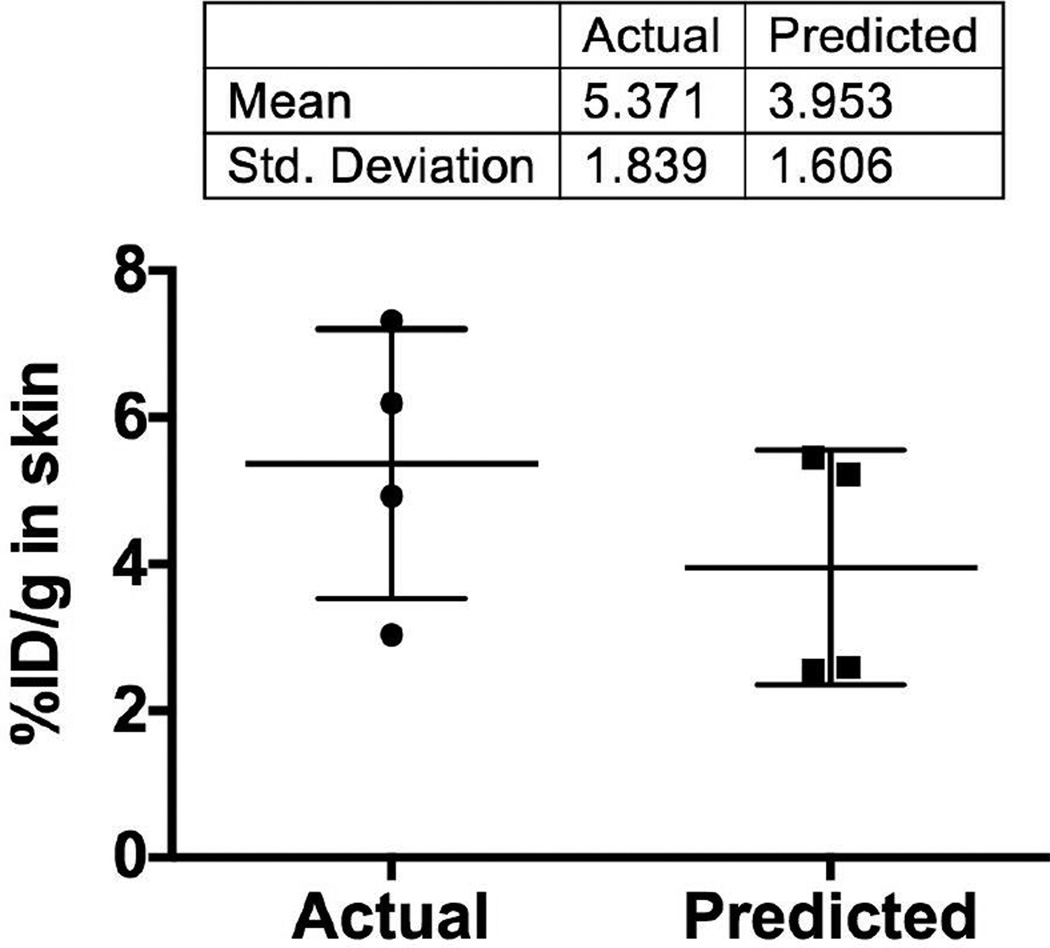
Fig. 7. Predicted versus actual percentage of injected dose per gram skin (%ID/g) for PEGylated liposomes.
Deposition of liposomes was quantified as described in Methods using 4 skin samples per mouse (Supplemental Fig. 5). Individual points show average value for each mouse (n=4). The predicted values were calculated as described in the Results section using FONIRS data from 4 mice per group (Supplemental Fig. 5A). Predicted values agreed well with the actual values.

