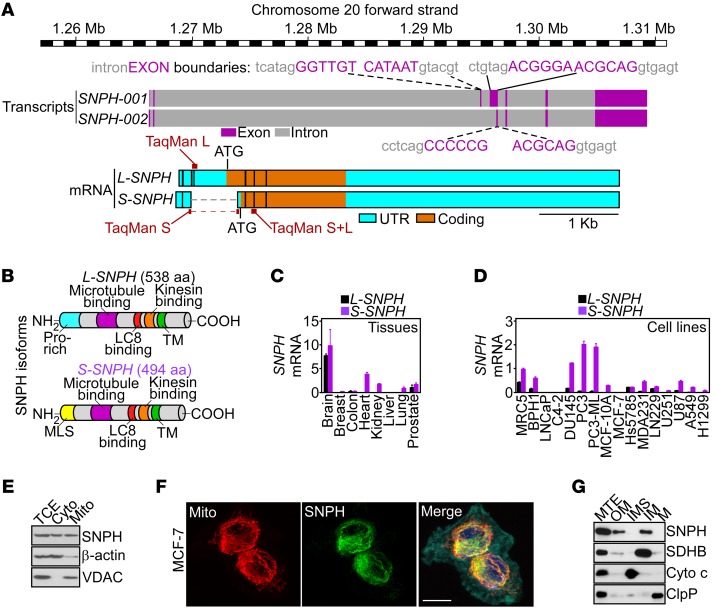
Figure 1. SNPH isoforms.
(A) Schematic diagram of the human SNPH locus (based on the Vertebrate Genome Annotation [Vega] repository; http://vega.archive.ensembl.org/index.html). The position and sequences of intron-exon boundaries, long (L) or short (S) SNPH transcripts, and TaqMan gene expression assays utilized for mRNA amplification of the two SNPH isoforms are indicated. (B) Schematic diagram of L-SNPH or S-SNPH protein isoforms. Pro, proline. (C and D) The indicated normal human tissues (C), normal diploid (MRC5) cells, or tumor cell types (D) were analyzed for L-SNPH or S-SNPH mRNA copy number, and normalized to 1,000 molecules of β-actin. Mean ± SEM (n = 3 per tissue or cell line examined). (E) PC3 cells were fractionated in cytosol (Cyto) or mitochondrial (Mito) extracts and analyzed by Western blotting. TCE, total cell extracts. (F) MCF-7 cells devoid of endogenous SNPH as in D were transfected with SNPH cDNA and analyzed by fluorescence microscopy. Merge image includes the F-actin channel (cyan). Scale bar: 5 μm. (G) PC3 cells were fractionated in sub-mitochondrial extracts containing outer membrane (OM), inter-membrane space (IMS), inner membrane (IM), or matrix (M) and analyzed by Western blotting. The expression of SDHB, cytochrome c (Cyto c), or ClpP was used as a markers for each fraction. MTE, unfractionated mitochondrial extracts.

