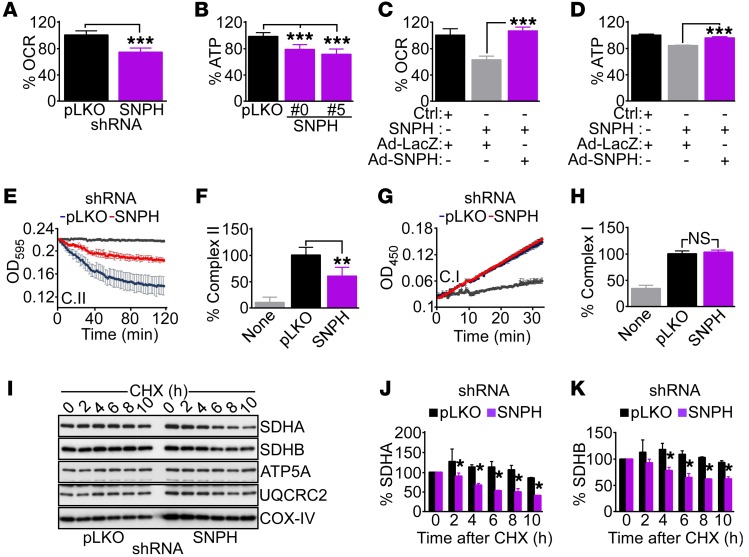
Figure 2. SNPH regulation of mitochondrial bioenergetics.
(A and B) PC3 cells stably transduced with control pLKO or shRNA-SNPH (clone 0 or 5) were analyzed for OCR (A) or ATP production (B). Data are expressed as mean ± SD of replicates of a representative experiment (n = 3). ***P < 0.0001, by 2-tailed Student’s t test (A). ***P < 0.001 by ANOVA and Bonferroni’s post-test (B). (C and D) PC3 cells transfected with control siRNA (Ctrl) or siRNA-SNPH were transduced with control adenovirus (Ad-LacZ) or SNPH-directed adenovirus (Ad-SNPH), and analyzed for OCR (C) or ATP production (D). Data are expressed as mean ± SD of replicates of a representative experiment (n = 3). ***P < 0.001 by ANOVA and Bonferroni’s post-test. (E and F) PC3 cells transduced with pLKO or shRNA-SNPH were analyzed for oxidative phosphorylation complex II (C.II) activity (E) and normalized to citrate synthase activity (F). Gray tracing, blank reaction. Data are expressed as mean ± SD of replicates of a representative experiment (n = 3). **P < 0.01 by ANOVA and Bonferroni’s post-test. (G and H) The experimental conditions were as in E and F, except that transduced PC3 cells were analyzed for oxidative phosphorylation complex I (C.I) activity (G) and normalized to citrate synthase activity (H). Gray tracing, blank reaction. Data are expressed as mean ± SD of replicates of a representative experiment (n = 3). NS, not significant (P > 0.05) by ANOVA and Bonferroni’s post-test. (I) PC3 cells transduced with pLKO or shRNA-SNPH were treated with CHX, and aliquots of cell extracts harvested at the indicated time intervals after release (h) were analyzed by Western blotting. (J and K) Protein bands from the experiment in I were quantified by densitometric scanning after CHX release. Changes in SDHA (J) or SDHB (K) protein bands in pLKO or shRNA-SNPH are shown. Data are expressed as mean ± SD (n = 4). The statistical analyses are as follows: SDHA (J), 2 hours, P = 0.05; 4 hours, P < 0.0001; 6 hours, P = 0.0001; 8 hours, P = 0.0001; 10 hours, P < 0.0001; SDHB (K), 2 hours, P = 0.14; 4 hours, P = 0.0007; 6 hours, P < 0.0001; 8 hours, P < 0.0001; 10 hours, P < 0.0001, by 2-tailed Student’s t test.

