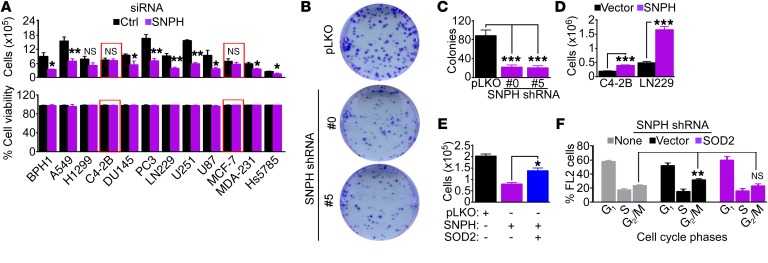
Figure 5. Mitochondrial SNPH supports tumor cell proliferation.
(A) The indicated tumor cells transfected with control siRNA (Ctrl) or siRNA-SNPH were analyzed by direct cell counting (top) or cell viability by trypan blue exclusion (bottom) after 72 hours. The same number of cells were seeded at time 0. Data are expressed as mean ± SEM (n = 4). Red boxes indicate two cell types (C4-2B and MCF-7) with low to undetectable levels of endogenous SNPH. The statistical analyses per each cell type are as follows: BPH1, P = 0.03; A549, P = 0.004; H1299, NS; C4-2B, NS; DU145, P = 0.03; PC3, P = 0.002; LN229, P = 0.002; U251, P < 0.0001; U87, P = 0.03; MCF-7, NS; MDA-231, P = 0.01; Hs578T, P = 0.02 by 2-tailed Student’s t test. (B and C) PC3 cells transduced with pLKO or shRNA-SNPH (clones 0 and 5) were analyzed in a colony formation assay, and crystal violet–stained colonies (B) were counted after 10 days (C). Data are expressed as mean ± SEM (n = 3). ***P < 0.001 by ANOVA and Bonferroni’s post-test. (D) The indicated tumor cell types were transfected with vector or SNPH cDNA and analyzed by direct cell counting after 72 hours. Data are expressed as mean ± SD (n = 3). ***P < 0.0001, by 2-tailed Student’s t test. (E) PC3 cells transduced with pLKO or shRNA-SNPH were transfected with SOD2 cDNA and analyzed by direct cell counting. Data are expressed as mean ± SD (n = 3). *P < 0.01, by ANOVA and Bonferroni’s post test. (F) PC3 cells transduced with shRNA-SNPH were reconstituted with vector or SOD2 cDNA and analyzed by propidium iodide staining and flow cytometry. The cellular fractions in the indicated cell cycle phases are indicated. Data are expressed as mean ± SD (n = 3). **P = 0.01 by 2-tailed Student’s t test.

