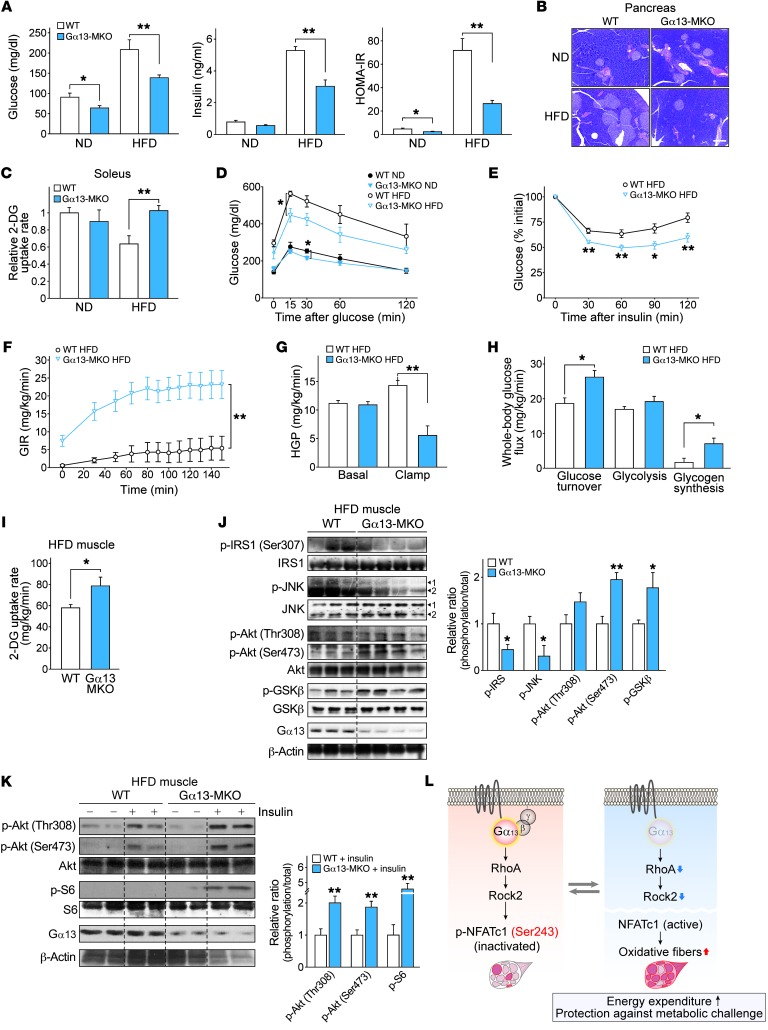
Figure 10. Gα13-MKO protects mice from diet-induced insulin resistance.
(A–C) Nine-week-old WT and Gα13-MKO mice were fed a ND or a HFD. After 9 weeks of HFD feeding, the mice were fasted overnight and then sacrificed (n = 6–8 each). (A) Fasting serum glucose and insulin levels. Homeostasis model assessment of insulin resistance (HOMA-IR) was calculated from both parameters. (B) Representative H&E staining of pancreatic islets. Scale bar: 200 μm. (C) Maximal 2-deoxyglucose (2-DG) uptake assay using isolated soleus muscles. (D) Glucose tolerance test and (E) insulin tolerance test. Following overnight fasting, mice fed a ND or a HFD for 7 weeks were subjected to blood glucose measurement immediately after i.p. injection of glucose or insulin (n = 6–8 each). (F–I) Whole-body and tissue-specific insulin sensitivity was assessed in HFD-fed mice using a hyperinsulinemic-euglycemic clamp (n = 6–7 each). (F) Glucose infusion rate (GIR). (G) Hepatic glucose production (HGP) rates. (H) Whole-body glucose uptake, glycolysis, and glycogen synthesis rates. (I) 2-DG uptake rates in gastrocnemius immediately after a clamp assay. (J and K) Immunoblots for the markers of insulin sensitivity in soleus muscle. (J) Nine-week-old mice were fed a HFD for 9 weeks and then fasted overnight. (K) Mice of each genotype were fed a HFD for 9 weeks and then sacrificed 15 minutes after an i.p. insulin injection. (L) Schematic diagram illustrating how Gα13 and downstream signaling molecules regulate muscle fiber type and metabolic homeostasis. For J and K, each blot was obtained from samples run on parallel gels. For A and C–K, data represent the mean ± SEM. *P < 0.05 and **P < 0.01, by Student’s t test.

