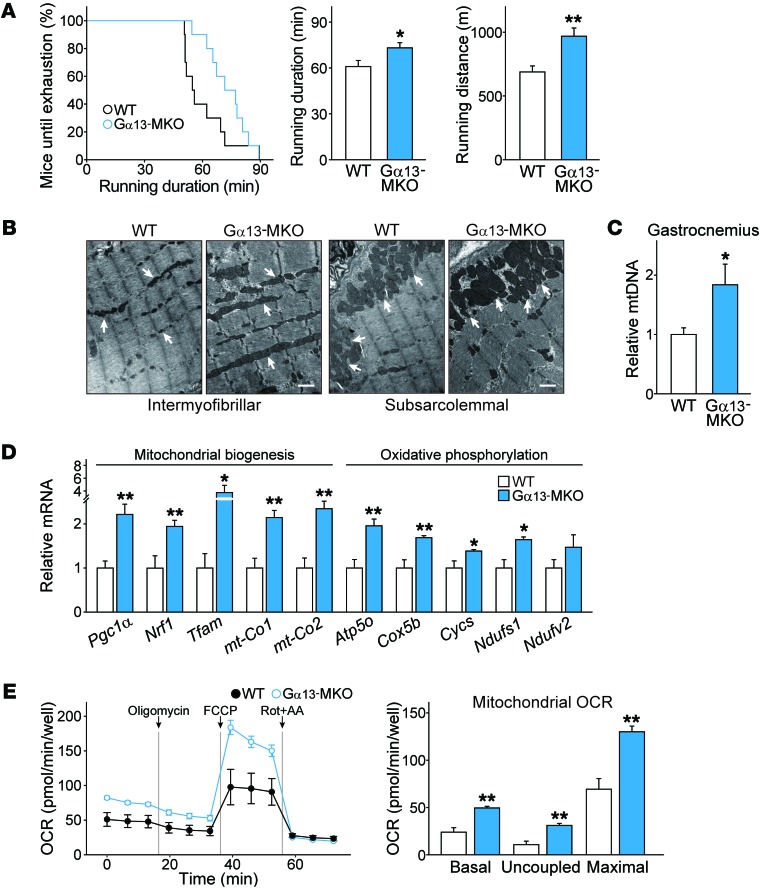
Figure 3. Loss of Gα13 results in higher endurance exercise capacity and mitochondrial function.
(A) Endurance capacity of Gα13-MKO mice compared with that of WT mice. Percentage of mice running until exhaustion and maximum running duration and distance in endurance exercise tests (n = 10 per genotype). (B) Transmission electron micrographs of longitudinal sections of soleus muscle. Arrows point to mitochondria. Scale bars: 1 μm. (C) Quantification of mitochondrial DNA (mtDNA) content (n = 3 each). The copy number ratio of mitochondrial/nuclear DNA was measured by qPCR analysis for Mt-co2 and Nrip1 using total DNA isolated from gastrocnemius muscles. (D) qPCR assays. Tibialis anterior muscles were prepared from mice that had been fasted overnight (n = 6–8 each). (E) Respiration assay. The OCR of primary satellite cell–derived myotubes from mice of each genotype. The OCRs of basal, uncoupled (by addition of oligomycin), maximal (with FCCP), and nonmitochondrial respiration (with rotenone plus antimycin A [Rot+AA]) were determined using an XFp Extracellular Flux Analyzer. Real-time triplicate readings (left) and calculated mitochondrial respiration rates (right) are shown (n = 3 each). For A and C–E, data represent the mean ± SEM. *P < 0.05 and **P < 0.01, by Student’s t test.

