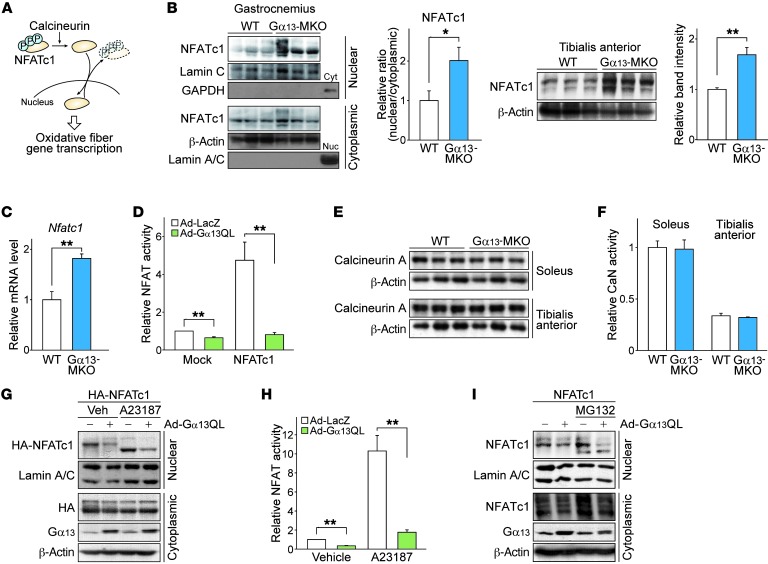
Figure 4. Gα13 signaling inhibits NFATc1 independently of calcineurin.
(A) Schematic diagram of the NFATc1 signaling pathway. Translocation is controlled by (de)phosphorylation at multiple sites. Nuclear NFATc1 mediates the oxidative conversion of myofibers. (B and C) Effect of Gα13 on intracellular localization and total expression levels of NFATc1 (n = 3 each). (B) Left: Immunoblot for NFATc1 in mouse gastrocnemius muscle. Mice were fasted overnight, before sacrifice. Nuc, nuclear fraction; Cyt, cytoplasmic fraction. Right: Immunoblot for NFATc1 in the total lysate of mouse tibialis anterior muscle. (C) Nfatc1 transcript levels in tibialis anterior muscle. (D) NFATc1 transcriptional activity assays (n = 3 each). A luciferase reporter construct with 3 NFAT binding sites upstream of a transcription start site was transfected into C2C12 myotubes with NFATc1-expressing or control vector. Myotubes were then infected with adenovirus expressing the indicated genes, and luciferase activity was assayed 48 hours later. Gα13QL, a CA Q229L mutant of Gα13. (E) Immunoblots for calcineurin A in the indicated skeletal muscles from mice fasted overnight. (F) Calcineurin (CaN) phosphatase activity was measured using an RII substrate peptide on the same skeletal muscles as in E. The relative activity represents the difference between total phosphatase activity and that in the presence of EGTA, as normalized by protein content in the lysates. (G and H) Immunoblotting (G) and transcriptional activity assays (H) for NFATc1. C2C12 myotubes were transfected with HA-tagged NFATc1 expression vector, followed by adenoviral infection of LacZ or Gα13QL. Vehicle (Veh) or A23187 was added 12 hours before the assay. (I) Immunoblots for NFATc1. After adenoviral infection, C2C12 myotubes were treated with MG132 (10 μM) for 12 hours. Ad, adenovirus. For B, G, and I, each blot was obtained from samples run on parallel gels. For B–D, F, and H, data represent the mean ± SEM. *P < 0.05 and **P < 0.01, by Student’s t test.

