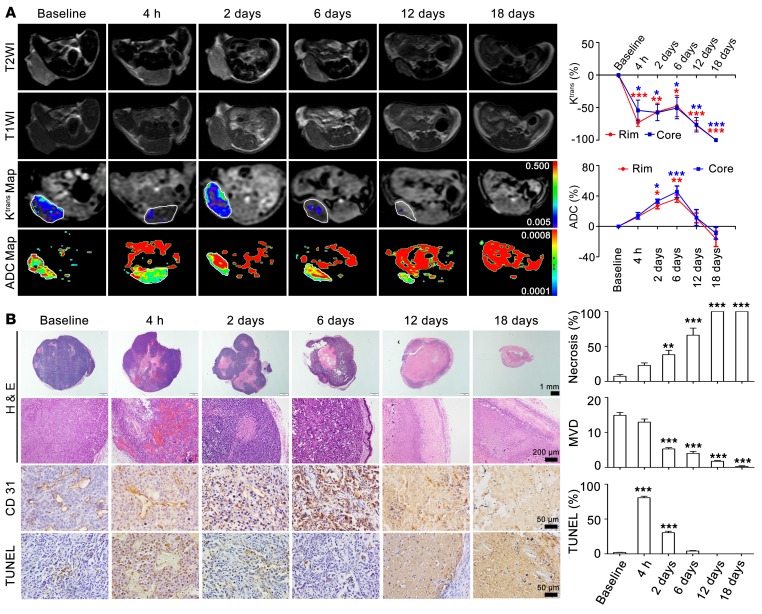
Figure 5. MRI monitoring of the vascular disruption effects of Z-GP-DAVLBH on MDA-MB-231 xenografts.
(A) MRI images of tumors throughout therapy with Z-GP-DAVLBH (left). The white rings indicate the tumors. Quantification of Ktrans and ADC values is shown (right, n = 5). The mice bearing MDA-MB-231 xenografts received i.v. injection of Z-GP-DAVLBH (2 μmol/kg) once every 2 days. (B) H&E staining shows increased necrosis in both the tumor core and rim accompanied by prolonged treatment. The entire tumor was necrotic after 12 days of treatment. CD31 staining shows decreased microvascular density (MVD), and tumor sections stained with TUNEL show apoptotic tumor cells. Tumors were harvested at each MRI examination time point. Three images were obtained per tumor, and the quantification of images is shown (n = 5). Data are shown as mean ± SEM. *P < 0.05; **P < 0.01; ***P < 0.001 versus baseline group (1-way ANOVA with Tukey’s post hoc comparison).

