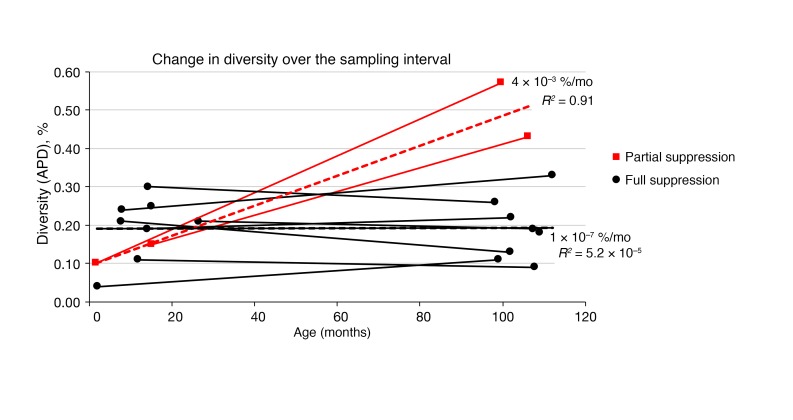
Figure 2. HIV-1 diversity as a function of age.
Changes in the APD at baseline compared with 7 to 9 years of viremia suppression on ART. The 2 children with unsuppressed viremia are shown in red and the others in black. The heavy dashed lines show the linear regression for all relevant sequences in aggregate, with the slopes and R2 values indicated. Results from a total of 20 samples are included in this figure.

