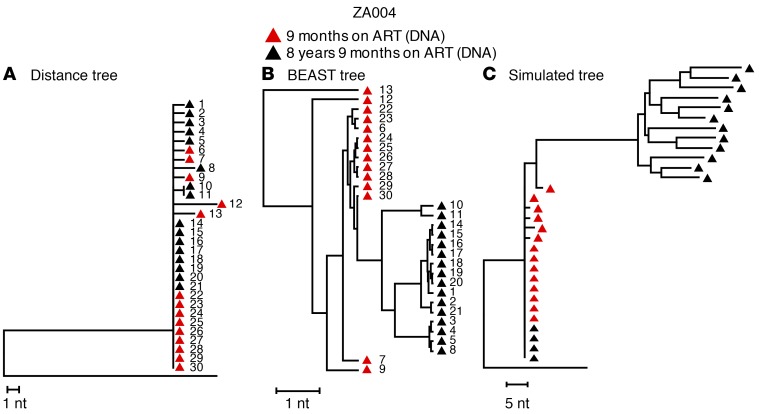
Figure 3. Comparison of analytical approaches.
(A) NJ tree of the sequences from a child (PID ZA004) who started treatment at less than 3 months of age and had full viremia suppression for 8.9 years (Supplemental Table 1). This tree is identical to that shown in Figure 1D for the same child. Red triangles indicate single-genome DNA sequences obtained 9 months after ART initiation. Black triangles indicate single-genome DNA sequences obtained 8 years later. The distance tree shows that the populations did not shift for 8 years on ART; populations at both time points were almost completely homogeneous, with only 8 nucleotide differences in 16,800 bases at baseline and 9 nucleotide differences in 19,200 bases 8 years later. The founder sequences persisted across the sampling time points. (B) The same sequences analyzed by BEAST using a strict molecular clock (as in ref. 10) show divergence over time, despite the identity of most sequences at both time points. Individual sequences are numbered identically in the 2 trees shown in A and B. (C) Simulated NJ distance tree using the estimated HIV evolution rate of 6.24 × 10⁻⁴ substitutions/site/month from ref. 10, applying the baseline sequences from the same child as in A and B. The simulated tree shows artifactual evolution, while the actual tree shows no evidence of sequence divergence after 8 years of ART.

