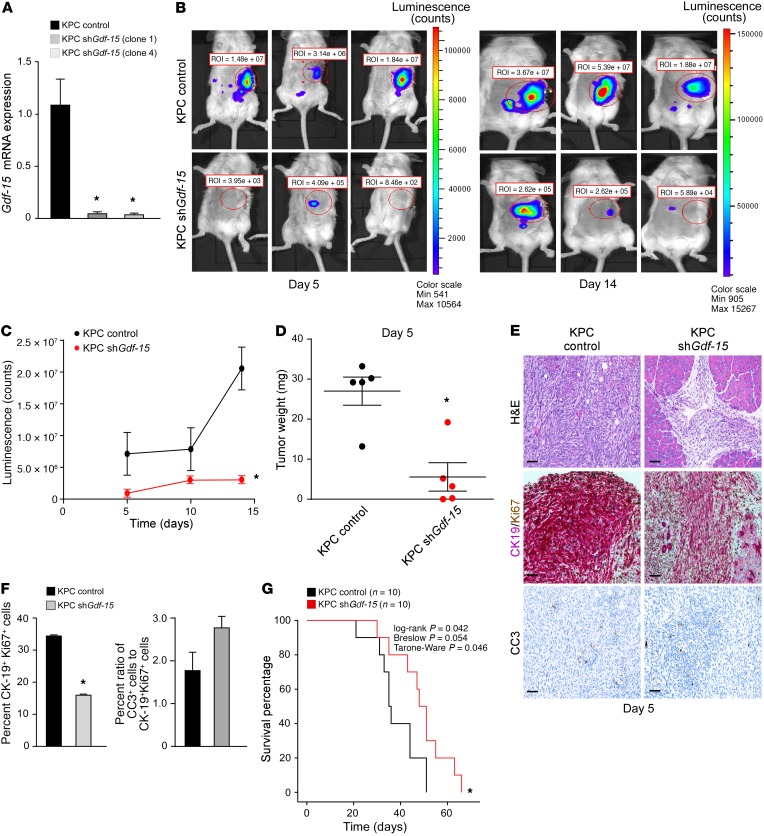
Figure 3. GDF-15 is required for development of KRas-induced PDAC.
(A) KPC cells expressing an shRNA against Gdf-15 were generated (2 clones, 1 and 4). Data are plotted as average gene expression (normalized to Gapdh) ± SEM. n = 3. *P ≤ 0.05, Student’s t test. (B) KPC control and KPC Gdf-15–knockdown cells (described above as clone 1) were injected orthotopically into the tail of the pancreas in C57BL/6 albino mice. Tumor growth was tracked by bioluminescence imaging. Shown are representative images tracking tumor growth of the mice. (C) The graph represents tumor growth derived from bioluminescence measured in B. n = 6 per cohort. Data are shown as mean ± SEM. *P ≤ 0.05, SPSS repeated measures, general linear model. (D) KPC control and KPC Gdf-15–knockdown cells (described above as clone 1) were injected orthotopically into the tail of the pancreas in C57BL/6 albino mice. The graph represents the average weight of tumors obtained from cohorts of 5 mice per condition similar to what is shown in Figure 2C. *P ≤ 0.05, Student’s t test. (E) Control and Gdf-15–knockdown orthotopic tumors were analyzed for H&E, CK19, and Ki67 colocalization and CC3. Original magnification, ×20. Scale bar: 15 μm. (F) CK19 (cytoplasmic, pink)/ Ki67 (nuclear, brown) dual staining was quantitated and graphed from 5 mice per condition from at least 5 fields of view of the tumor area per mouse. Data are shown as mean ± SEM. *P ≤ 0.05, Student’s t test. For CC3 staining, quantitation from staining signal was graphed as a ratio of the percentage of CC3+ cells to the percentage average of proliferating cells. Data are shown as mean ± SEM. Student’s t test, NS. (G) Kaplan-Meier curve assessing survival of C57BL/6 albino mice (n = 10 per cohort) injected with either KPC control or KPC Gdf-15–knockdown cells.

