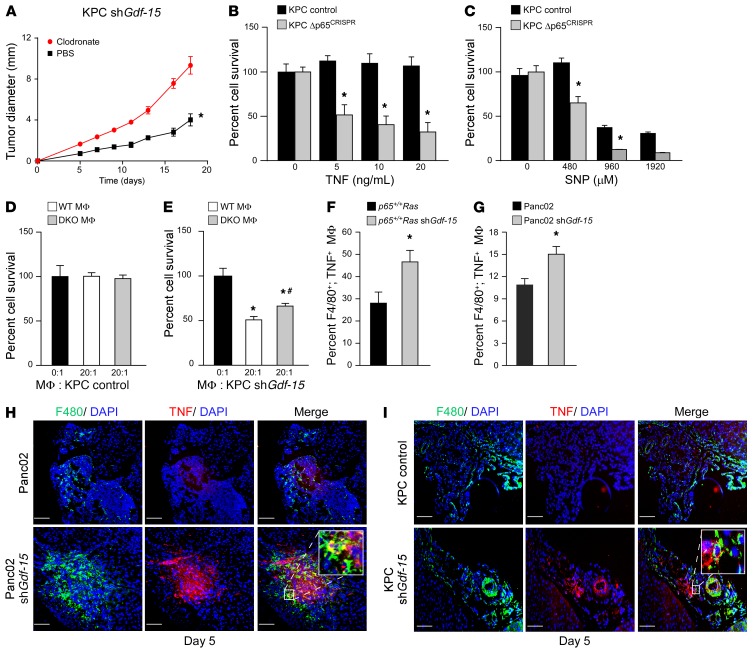
Figure 6. GDF-15 suppresses macrophage cytotoxicity by inhibiting TNF.
(A) KPC Gdf-15–knockdown cells were injected into mice and treated with clodronate liposomes or control liposomes biweekly. Tumor sizes were measured. n = 5 per cohort. Data are shown as mean ± SEM. *P ≤ 0.05, SPSS repeated measures, general linear model. (B and C) MTS assay following TNF and SNP treatment of KPC control and Δp65CRISPR cells. Data represent the mean of 2 independent experiments performed in triplicate. *P ≤ 0.05, 2-way ANOVA. (D and E) KPC control and Gdf-15–knockdown cells were cocultured with WT or Tnf and iNOS DKO macrophages. Graph represents cell survival. n = 6. Data are shown as mean ± SEM. *P ≤ 0.05 compared with 0:1; #P ≤ 0.05 compared with 20:1 WT macrophages, 1-way ANOVA. (F) Ras MEFs knockdown for Gdf-15 were injected into SCID mice, and macrophages were harvested and analyzed by FACS for F4/80+ and TNF+. Graph represents mean ± SEM of F4/80+; TNF+ double-positive cells from 6 mice in 2 independent experiments. *P ≤ 0.05, Student’s t test. (G) FACS analysis similar to F performed on SCID mice (n = 5 for each group) following intraperitoneal injections with Panc02 control and Gdf-15–knockdown cells. Graph represents mean ± SEM of F4/80+; TNF+ double-positive macrophages. *P ≤ 0.05, Student’s t test. (H) Immunohistochemistry on tumors following injections of Panc02 control and Gdf-15–knockdown cells. Tumors were harvested, sectioned, and stained for F4/80 and TNF and nuclei counterstained with DAPI. Inset represents magnified image of F4/80+, TNF+ macrophages in Gdf-15–knockdown Panc02 tumors. (I) Tumors harvested from KPC control and Gdf-15 shRNA–injected C57BL/6 albino mice 5 days after injection were sectioned and stained in the same way as the Panc02 cells. Inset represents magnified image of F4/80+, TNF+ macrophages in Gdf-15–knockdown KPC tumors. Original magnification, ×20. Magnification in insets ×20. Scale bar: 100 μm.

