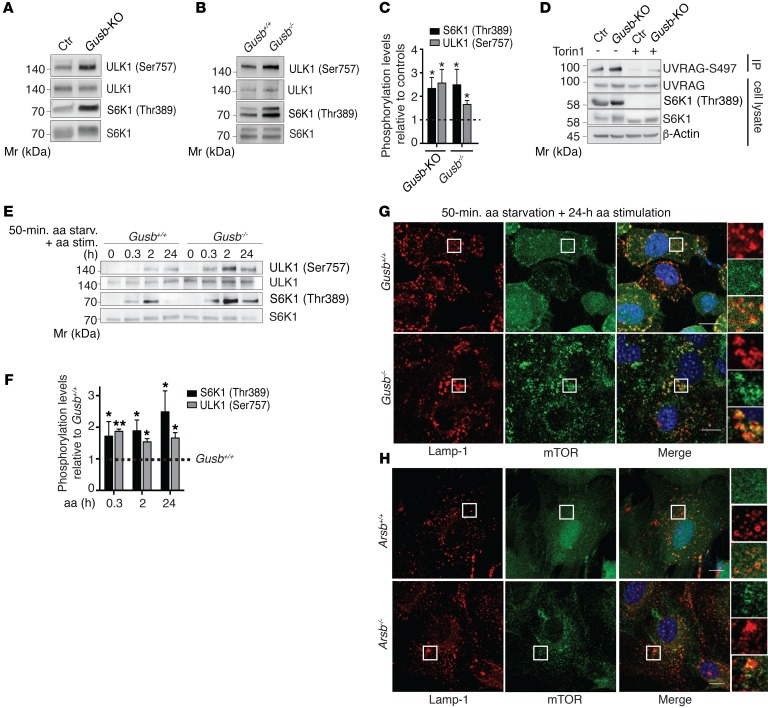
Figure 1. Enhanced mTORC1 signaling in LSD chondrocytes.
(A) Western blot analysis of mTORC1 substrates in control (Ctr) and Gusb-KO RCS cells (A) and in primary chondrocytes from Gusb+/+ and Gusb–/– mice (B). (C) Quantification of phosphorylation levels relative to control levels (dashed line). n = 3. (D) Representative blot from a UVRAG IP assay in control and Gusb-KO RCS chondrocytes with or without Torin1 treatment (1 μM; 6 h). n = 3. (E) Western blot analysis of mTORC1 signaling on a time course of amino acid stimulation in Gusb+/+ and Gusb–/– primary chondrocytes. Cells were starved (starv.) of amino acids for 50 minutes and then stimulated (stim.) with amino acids for the indicated durations. (F) Bar graph displays phosphorylation levels of the indicated mTORC1 substrates (normalized to their total levels). Values are expressed as the fold increase compared with Gusb+/+ (represented by a dashed line). n = 3. (G and H) Gusb–/– (G) and Arsb–/– (H) primary chondrocytes were starved of amino acids for 50 minutes and then stimulated with amino acids for the indicated durations. Cells were then processed in an immunofluorescence assay to detect mTOR and Lamp-1, costained with DAPI for DNA content, and imaged. Insets show zoom ×3 and single-color channels of the boxed areas. Scale bars: 10 μm. Quantification of Lamp-1–mTOR colocalization is shown in Supplemental Figure 3. Data represent the mean values derived from the indicated number of independent experiments. Error bars indicate the SEM. *P ≤ 0.05 and **P ≤ 0.005, by unpaired Student’s t test. Mr, marker.

