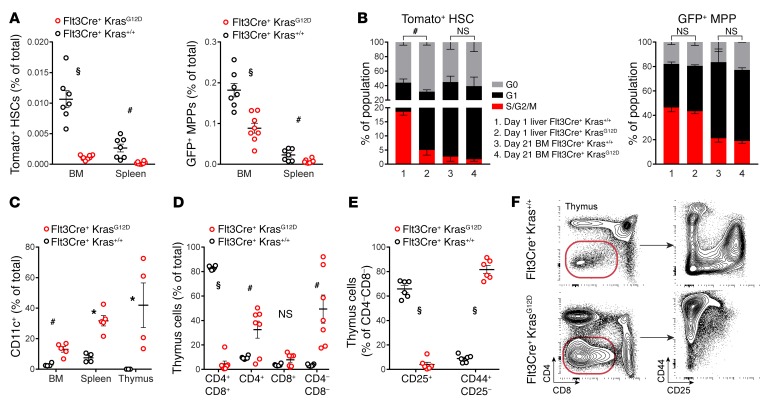
Figure 3. Analysis of Flt3Cre+ KrasG12D progenitor frequency and differentiation.
(A) Frequency of HSCs and MPPs in the BM and spleens of mutants and littermates. (B) Cell-cycle analysis of HSCs and MPPs from 1-day-old liver (n = 3 WT and 4 mutants) and 21-day-old BM (n = 2/group); representative gating is shown in Supplemental Figure 9. (C) Flow cytometric quantification of tissue DCs. (D–F) Flow cytometric quantification and representative gating of thymic cells. Error bars represent the SEM. Cell-cycle statistical analyses were performed using a χ2 test, and other analyses were performed using an unpaired, 2-tailed Student’s t test. *P < 0.05, #P < 0.01, and §P < 0.001.

