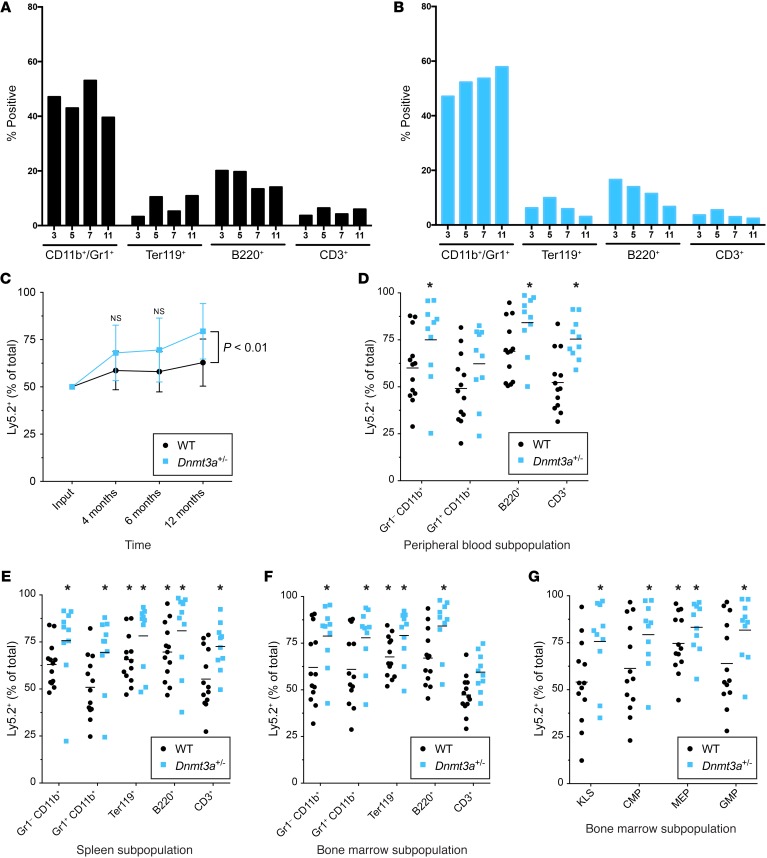
Figure 4. Bone marrow cells from Dnmt3a+/– mice display myeloid skewing and a competitive advantage that is time dependent.
(A and B) Flow cytometric evaluation of lineage markers from the bone marrow cells of unmanipulated mice harvested at the indicated ages, designated in months (n = 1 per genotype per time point). (A) Dnmt3a+/+ mice. (B) Dnmt3a+/– mice. (C–G) Bone marrow from 6-week-old Dnmt3a+/+ or Dnmt3a+/– mice (Ly5.2) was mixed 50:50 with WT competitor marrow (Ly5.1x5.2) and transplanted into lethally irradiated WT mice (Ly5.1). n = 13 Dnmt3a+/+; n = 10 Dnmt3a+/–. (C) Peripheral blood chimerism at 4 months, 6 months, and 1 year after transplant. P < 0.01, 2-sample, 2-tailed t test. (D–G) Percentage of Ly5.2+ cells (i.e., experimental cells, either Dnmt3a+/+ or Dnmt3a+/–) in the indicated lineage or progenitor populations at the 1-year time point. *P < 0.05, 1-sample, 2-tailed t test vs. 50% corrected for multiple testing by Bonferroni’s method. (D) Peripheral blood–derived cells. (E) Spleen-derived cells. (F and G) Bone marrow–derived cells.

