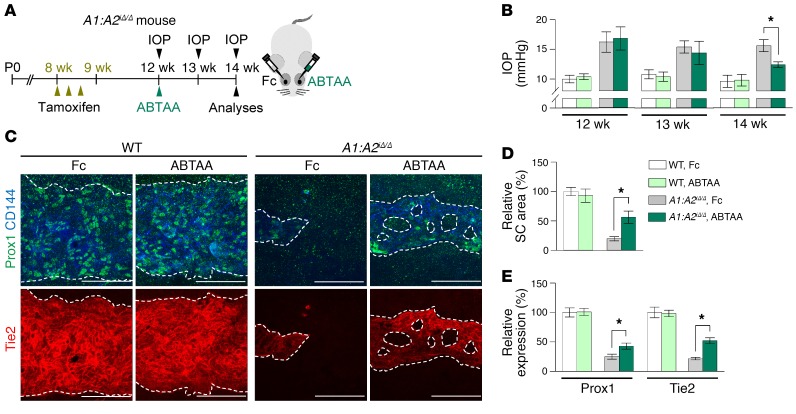
Figure 16. Tie2 activation rescues regressed SC of A1:A2iΔ/Δ mice.
(A) Diagram depicting the experiment schedule in WT and A1:A2iΔ/Δ mice for administration of tamoxifen, intraocular ABTAA (~5 μg, left eye), and Fc (~5 μg, right eye), periodic measurements of IOP, and analyses of their SCs. (B–E) Images and comparisons of IOP, relative area, and intensities of Prox1 and Tie2 immunostaining in CD144+ SC. Dashed lines demarcate SC. Scale bars: 100 μm. SC area and expression of each molecule in WT mice treated with Fc are normalized to 100%, and relative levels of other groups are presented. n = 5 for each group. *P < 0.05 by Kruskal-Wallis test followed by Tukey’s HSD test with ranks.

