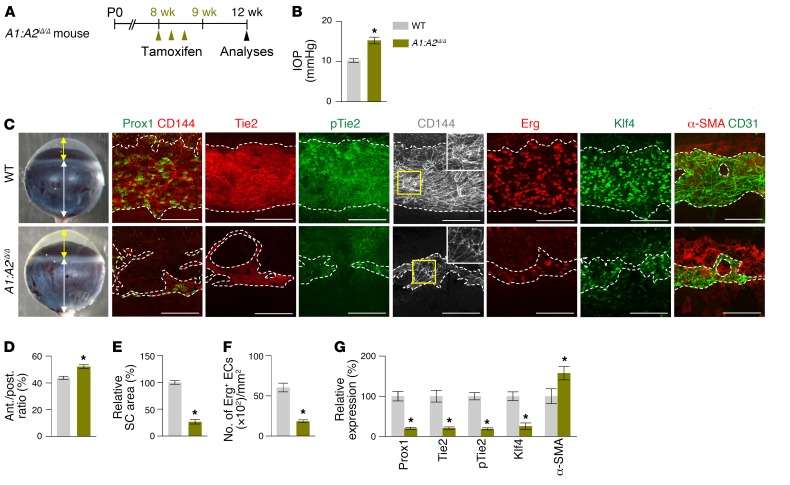
Figure 9. Combined depletion of Angpt1 and Angpt2 in adult mice causes SC regression.
(A) Diagram for combined global depletion of Angpt1 and Angpt2 in 8-week-old mice and analyses 4 weeks later using A1:A2iΔ/Δ mice. (B–G) Images and comparisons of IOP, an anterior (yellow double arrow)/posterior (white double arrow) segment ratio of the eyeball, relative area, number of Erg+ ECs, and intensities of Prox1, Tie2, p-Tie2, Klf4, and α-SMA immunostaining in CD144+ or CD31+ SC. Dashed lines demarcate the margins of SC. Each area marked by a yellow box is magnified in the corner. Scale bars: 100 μm. SC area and expression of each molecule in WT mice are normalized to 100%, and their relative levels in A1:A2iΔ/Δ mice are presented. n = 4–5 for each group. *P < 0.05 versus WT by Mann-Whitney U test.

