Figure 1.

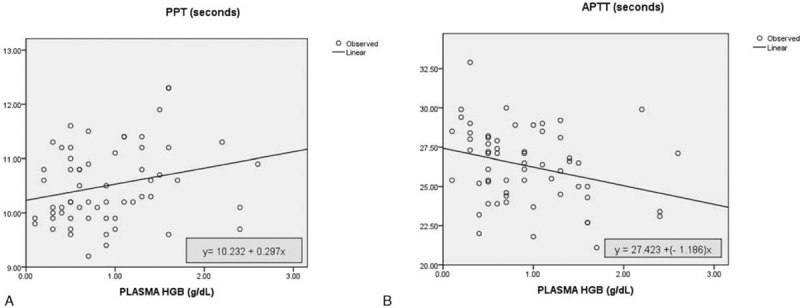
Regression linear curve of plasma hemoglobin level effects on (A) PPT with R = 0.294; P = .06; and (B) APTT with R = 0.245; P = .02.

Regression linear curve of plasma hemoglobin level effects on (A) PPT with R = 0.294; P = .06; and (B) APTT with R = 0.245; P = .02.