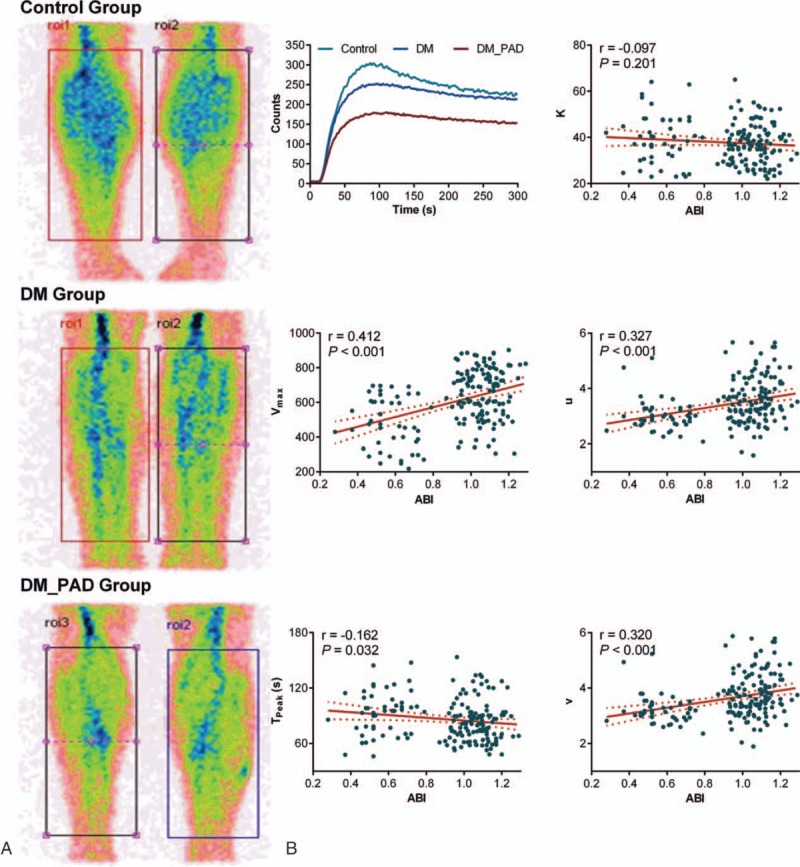
Figure 2.

(A) Representative posterior planar images following the injection of 99mTc-MIBI marked on both calves in the cases of each group. (B) Correlations of the 99mTc-MIBI scintigraphy perfusion parameters with the individual ABIs. Linear regression was used for the analyses. The solid line corresponds to the regression line, and the dashed line represents the 95% confidence band of the best-fit line. 99mTc-MIBI = Tc-99m 2 methoxy-isobutyl-isonitrile, ABI = ankle-brachial index.
