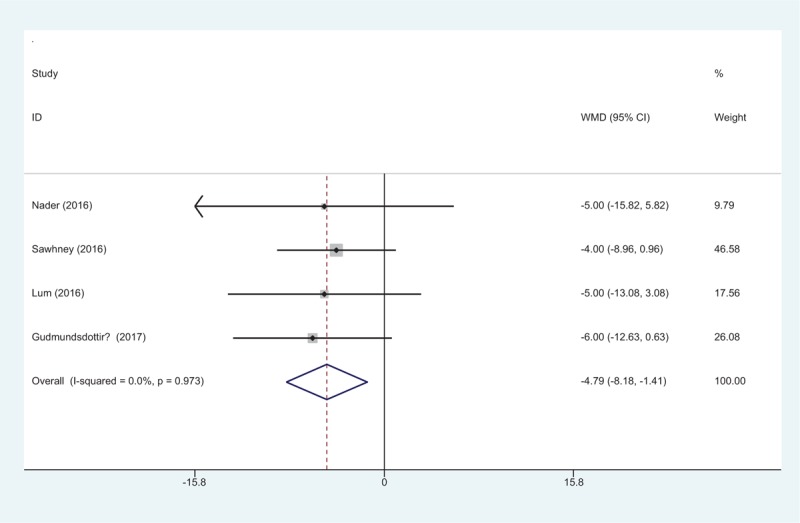
Figure 6.

Forest plot diagram showing opioid consumption at POD 1 after TKA. POD = postoperative day, TKA = total knee arthroplasty, WMD = weighted mean difference.

Forest plot diagram showing opioid consumption at POD 1 after TKA. POD = postoperative day, TKA = total knee arthroplasty, WMD = weighted mean difference.