
Figure 3.
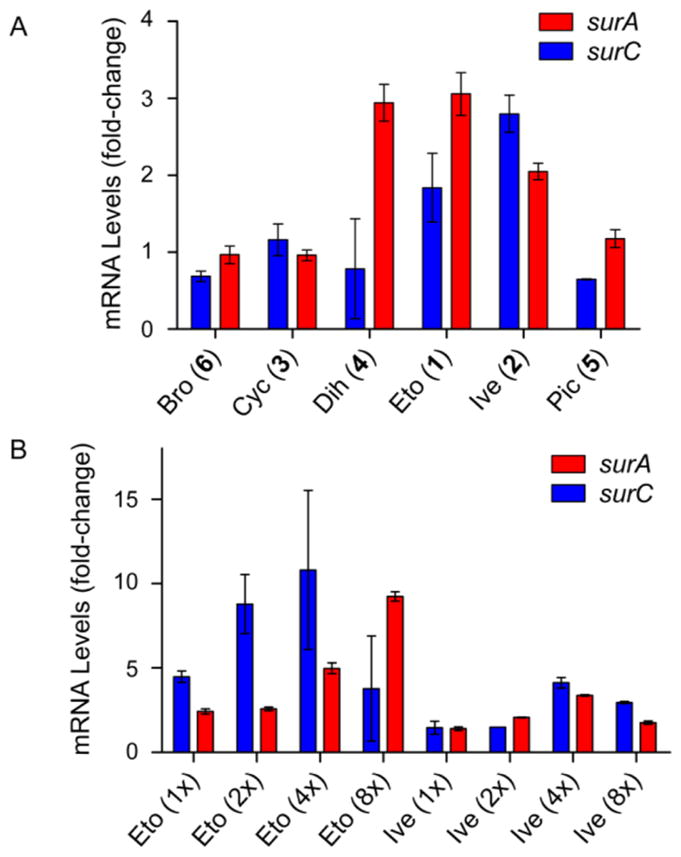
Effect of selected elicitors identified by HiTES on the expression of the sur BGC. (A) RT-qPCR analysis of the effects of the top six elicitors on sur expression. Shown is the observed fold-change in surA and surC mRNA levels compared to the DMSO negative control. (B) Concentration-dependence of the induction of sur by the top two elicitors (1 and 2), determined by RT-qPCR. Shown is the observed fold-change in mRNA levels with respect to the DMSO negative control. Note that 1x corresponds to a final concentration of 5.7 μM and 7.6 μM for 1 and 2, respectively.