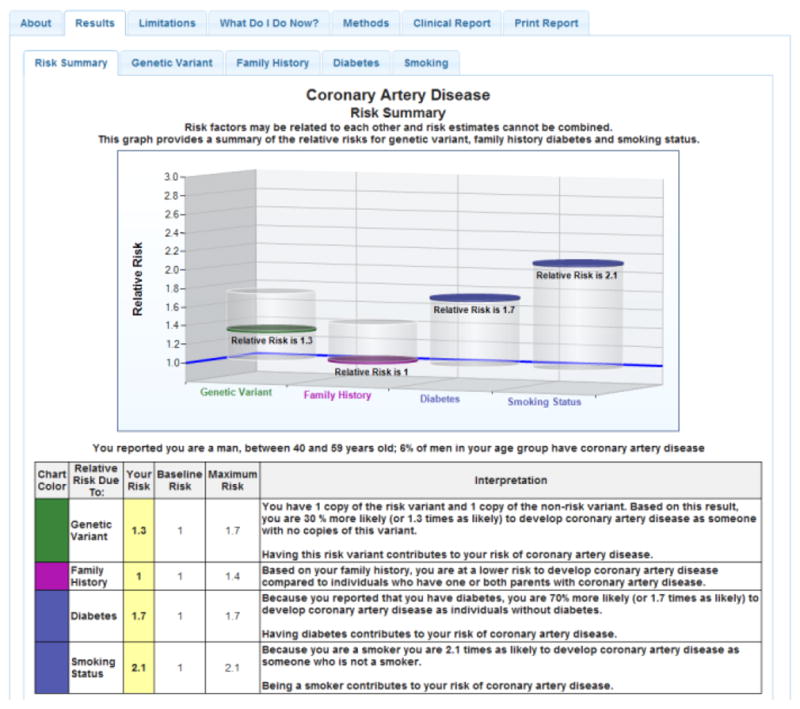
Figure 3.

Sample CPMC Coronary Artery Disease Report
Solid discs represent the participant’s relative risk, and vertical cylinders depict the range of relative risk (RR) values possible for the risk variable. On-line risk reports are organized using a tabbed approach, with separate tabs for disease condition information, risk results, limitations, methods or review educational material. To ensure readability, the CPMC test report design was informed by multiple rounds of pilot testing conducted by allowing individuals with no scientific background to review report drafts and provide feedback.
