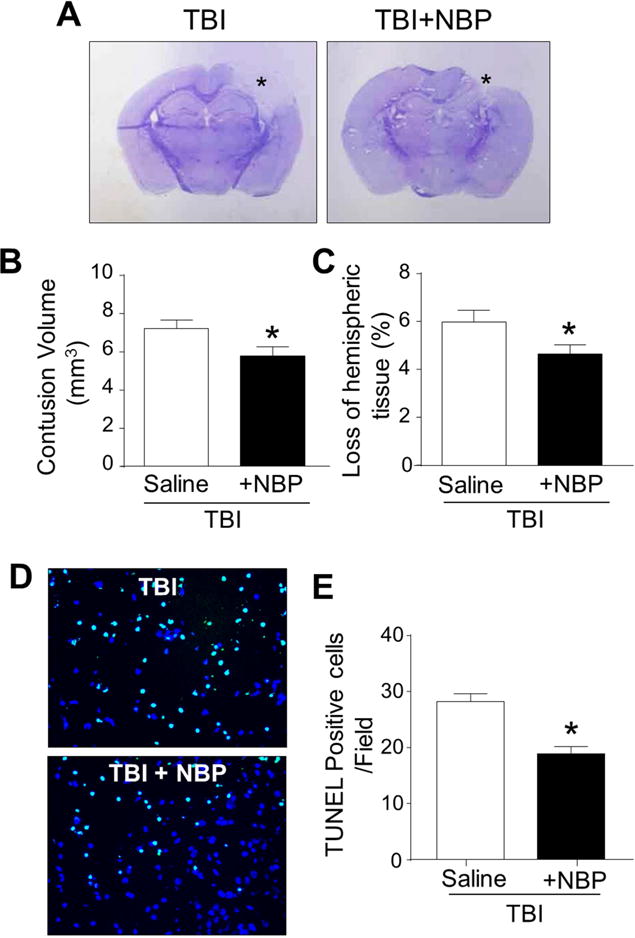
Figure 1. Tissue and cellular protective effects of NBP treatments after TBI.

TBI mice received repeated NBP treatments 5 min after TBI followed by 2 daily intranasal administrations. TBI-induced contusion volume and cell death were measured 3 days after the insult. A. Nissl staining shows brain sections from a TBI-saline control mouse and a TBI mouse received NBP treatments. The NBP treatment resulted in smaller contusion area (*). B and C. Bar graphs summarizes the measurements on contusion volume and the loss of hemispheric tissues in TBI-saline group and TBI plus NBP group. * P<0.05 versus TBI-saline controls by Student t test; N=12–13 per group. D. TUNEL staining revealed DNA damages and cell death 3 days after TBI. Total cells were visualized with Hoechst 33342 staining (blue). Massive TUNEL-positive cells (green) were observed in the TBI injured cortical region. The NBP treatment reduced TUNEL-positive cells. Scale bar = 50 μm. E. The percentage of TUNEL positive cells among total cells in the pericontusion area at 1 and 3 days after TBI. The bar graph summarized that NBP treatment after TBI significantly decreased death. * P<0.05 versus TBI-saline control group by Student t test; N=7 per group.
