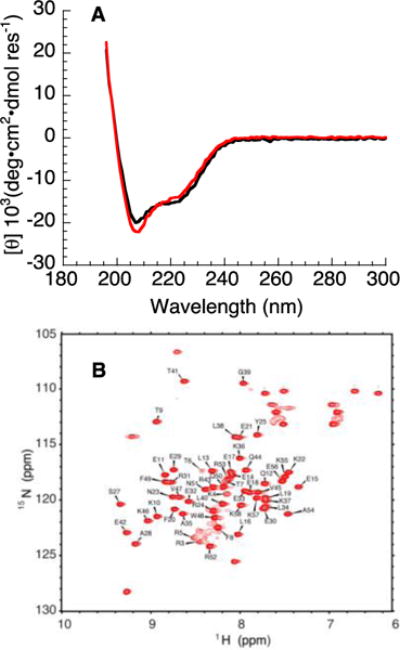
Figure 2. Circular dichorism spectroscopy and NMR spectroscopy of consensus-HD.

A) Far-UV CD spectra of consensus-HD (black) and engrailed-HD (red). B) 15N- 1H HSQC spectrum of uniformly 15N-labeled consensus-HD at 600 MHz. Assigned peaks are labeled. Conditions: 25 mM sodium phosphate, 150 mM NaCl, pH 7, 20 °C.
