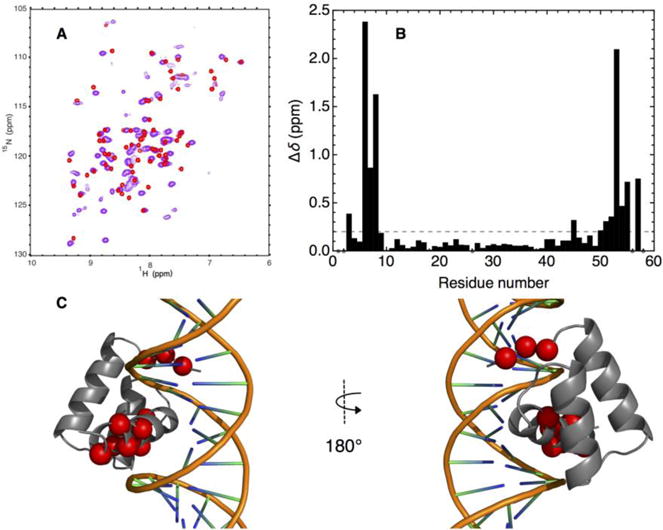
Figure 6. DNA-binding architecture of consensus-HD confirmed by NMR spectroscopy.

A) Overlay of 15N- 1H HSQC spectra of uniformly 15N labeled free consensus-HD (red) and DNA-bound consensus-HD (purple, 1.25-fold molar excess of duplex DNA) at 600 MHz. Conditions: 25 mM sodium phosphate, 150 mM NaCl, pH 7, 20 °C. B) Plot of weighted chemical shift perturbations for DNA binding to consensus-HD, calculated using equation 1, versus residue number. Dots at zero shift perturbation correspond to unassigned residues. Sequence numbering as in Figure 3. C) Residues with large chemical shift perturbations mapped on to the homeodomain structure (engrailed-HD:DNA cocrystal structure, PDB: 3HDD). Residues with chemical shift perturbations larger than 0.2 ppm (dashed line, Fig. 7b) are highlighted in red spheres centered at Cα.
